Data
233,650 items of data are available, covering 184,899 participants.
Some values have special meanings defined by Data-Coding
100586.
Defined-instances run from 0 to 3, labelled using Instancing
2.
Units of measurement are years.
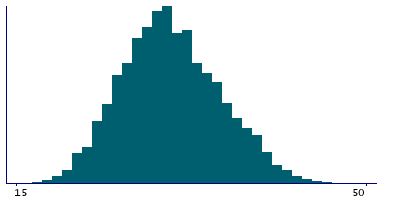
| Maximum | 62 |
| Decile 9 | 37 |
| Decile 8 | 35 |
| Decile 7 | 33 |
| Decile 6 | 31 |
| Median | 30 |
| Decile 4 | 29 |
| Decile 3 | 28 |
| Decile 2 | 26 |
| Decile 1 | 24 |
| Minimum | 15 |
|
|
- There are 41 distinct values.
- Mean = 30.4373
- Std.dev = 4.89112
- 8 items above graph maximum of 50
- 714 items have value -4 (Do not remember)
- 157 items have value -3 (Prefer not to answer)
|
4 Instances
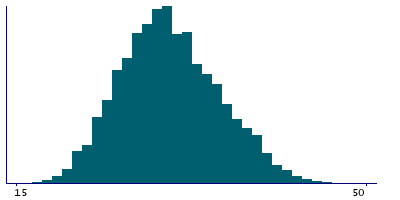
Instance 0 : Initial assessment visit (2006-2010) at which participants were recruited and consent given
184,788 participants, 184,788 items
| Maximum | 52 |
| Decile 9 | 37 |
| Decile 8 | 35 |
| Decile 7 | 33 |
| Decile 6 | 31 |
| Median | 30 |
| Decile 4 | 29 |
| Decile 3 | 27 |
| Decile 2 | 26 |
| Decile 1 | 24 |
| Minimum | 15 |
|
|
- There are 38 distinct values.
- Mean = 30.2665
- Std.dev = 4.89692
- 2 items above graph maximum of 50
- 628 items have value -4 (Do not remember)
- 139 items have value -3 (Prefer not to answer)
|
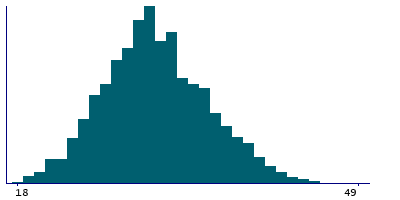
Instance 1 : First repeat assessment visit (2012-13)
6,951 participants, 6,951 items
| Maximum | 51 |
| Decile 9 | 37 |
| Decile 8 | 35 |
| Decile 7 | 33 |
| Decile 6 | 31 |
| Median | 30 |
| Decile 4 | 29 |
| Decile 3 | 28 |
| Decile 2 | 27 |
| Decile 1 | 25 |
| Minimum | 18 |
|
|
- There are 32 distinct values.
- Mean = 30.5485
- Std.dev = 4.73515
- 2 items above graph maximum of 49
- 8 items have value -4 (Do not remember)
- 1 items have value -3 (Prefer not to answer)
|
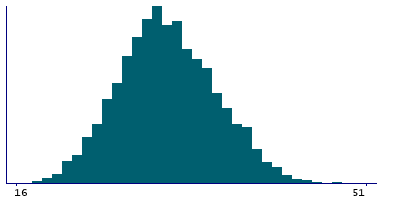
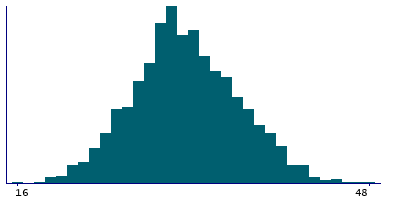
Instance 2 : Imaging visit (2014+)
34,945 participants, 34,945 items
| Maximum | 62 |
| Decile 9 | 38 |
| Decile 8 | 35 |
| Decile 7 | 34 |
| Decile 6 | 32 |
| Median | 31 |
| Decile 4 | 30 |
| Decile 3 | 29 |
| Decile 2 | 27 |
| Decile 1 | 25 |
| Minimum | 16 |
|
|
- There are 40 distinct values.
- Mean = 31.1923
- Std.dev = 4.83959
- 4 items above graph maximum of 51
- 66 items have value -4 (Do not remember)
- 15 items have value -3 (Prefer not to answer)
|
Instance 3 : First repeat imaging visit (2019+)
6,966 participants, 6,966 items
| Maximum | 50 |
| Decile 9 | 37 |
| Decile 8 | 35 |
| Decile 7 | 33 |
| Decile 6 | 32 |
| Median | 31 |
| Decile 4 | 30 |
| Decile 3 | 28 |
| Decile 2 | 27 |
| Decile 1 | 25 |
| Minimum | 16 |
|
|
- There are 34 distinct values.
- Mean = 31.0587
- Std.dev = 4.73331
- 1 item above graph maximum of 49
- 12 items have value -4 (Do not remember)
- 2 items have value -3 (Prefer not to answer)
|
Notes
ACE touchscreen question "How old were you when you had your LAST child?"
The following checks were performed:
- If answer < 8 then rejected
- If answer > 65 then rejected
- If answer > Participants age then rejected
- If answer < Age at first period then rejected
- If answer < 12 then participant asked to confirm
- If answer > 48 then participant asked to confirm
- If answer > Age when periods stopped then participant asked to confirm
Field 2764 was collected from women who indicated they had given birth to more than one child, as defined by their answers to Field 2734
Coding 100586 defines 2 special values:
- -4 represents "Do not remember"
- -3 represents "Prefer not to answer"


