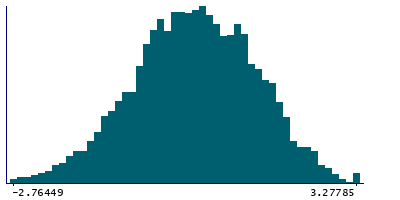
Data
4,316 items of data are available, covering 4,316 participants.
Defined-instances run from 0 to 1, labelled using Instancing
2.
Units of measurement are mm.
| Maximum | 3.27785 |
| Decile 9 | 1.80131 |
| Decile 8 | 1.35401 |
| Decile 7 | 1.04463 |
| Decile 6 | 0.71722 |
| Median | 0.430727 |
| Decile 4 | 0.145444 |
| Decile 3 | -0.15593 |
| Decile 2 | -0.474357 |
| Decile 1 | -0.996152 |
| Minimum | -2.76449 |
|
|
- Mean = 0.42019
- Std.dev = 1.07472
- 1 item above graph maximum of 3.27785
|
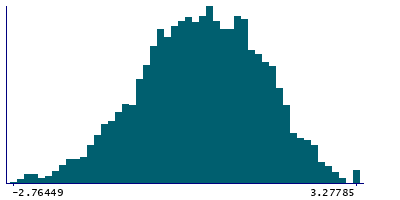
2 Instances
Instance 0 : Initial assessment visit (2006-2010) at which participants were recruited and consent given
3,229 participants, 3,229 items
| Maximum | 3.27785 |
| Decile 9 | 1.89586 |
| Decile 8 | 1.47808 |
| Decile 7 | 1.17336 |
| Decile 6 | 0.859397 |
| Median | 0.571829 |
| Decile 4 | 0.275098 |
| Decile 3 | -0.0315555 |
| Decile 2 | -0.368763 |
| Decile 1 | -0.877236 |
| Minimum | -2.76449 |
|
|
- Mean = 0.536017
- Std.dev = 1.07134
- 1 item above graph maximum of 3.27785
|
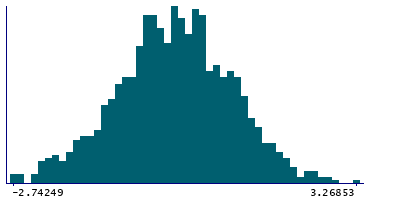
Instance 1 : First repeat assessment visit (2012-13)
1,087 participants, 1,087 items
| Maximum | 3.26853 |
| Decile 9 | 1.34816 |
| Decile 8 | 0.933096 |
| Decile 7 | 0.587049 |
| Decile 6 | 0.359431 |
| Median | 0.0923664 |
| Decile 4 | -0.187792 |
| Decile 3 | -0.42482 |
| Decile 2 | -0.744492 |
| Decile 1 | -1.21169 |
| Minimum | -2.74249 |
|
|
- Mean = 0.0761187
- Std.dev = 1.00911
|

