Data
146,488 items of data are available, covering 120,339 participants.
Some values have special meanings defined by Data-Coding
100353.
Defined-instances run from 0 to 3, labelled using Instancing
2.
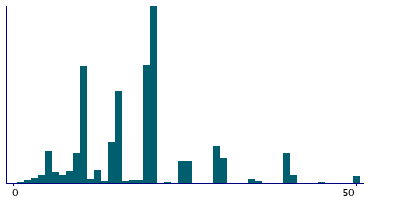
Units of measurement are cigarettes/day.
| Maximum | 140 |
| Decile 9 | 30 |
| Decile 8 | 20 |
| Decile 7 | 20 |
| Decile 6 | 20 |
| Median | 20 |
| Decile 4 | 15 |
| Decile 3 | 15 |
| Decile 2 | 10 |
| Decile 1 | 10 |
| Minimum | 1 |
|
|
- There are 66 distinct values.
- Mean = 18.7013
- Std.dev = 10.2206
- 1903 items above graph maximum of 50
- 198 items have value -10 (Less than one a day)
- 977 items have value -1 (Do not know)
|
4 Instances
Instance 0 : Initial assessment visit (2006-2010) at which participants were recruited and consent given
115,334 participants, 115,334 items
| Maximum | 140 |
| Decile 9 | 30 |
| Decile 8 | 25 |
| Decile 7 | 20 |
| Decile 6 | 20 |
| Median | 20 |
| Decile 4 | 15 |
| Decile 3 | 15 |
| Decile 2 | 10 |
| Decile 1 | 10 |
| Minimum | 1 |
|

|
- There are 64 distinct values.
- Mean = 19.073
- Std.dev = 10.502
- 1698 items above graph maximum of 50
- 164 items have value -10 (Less than one a day)
- 714 items have value -1 (Do not know)
|
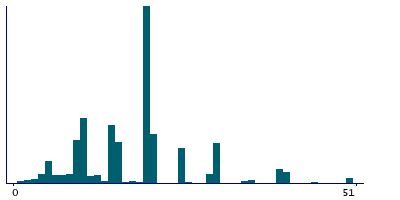
Instance 1 : First repeat assessment visit (2012-13)
4,766 participants, 4,766 items
| Maximum | 100 |
| Decile 9 | 30 |
| Decile 8 | 20 |
| Decile 7 | 20 |
| Decile 6 | 20 |
| Median | 20 |
| Decile 4 | 15 |
| Decile 3 | 15 |
| Decile 2 | 10 |
| Decile 1 | 9 |
| Minimum | 1 |
|
|
- There are 36 distinct values.
- Mean = 18.5441
- Std.dev = 9.7071
- 51 items above graph maximum of 51
- 4 items have value -10 (Less than one a day)
- 33 items have value -1 (Do not know)
|
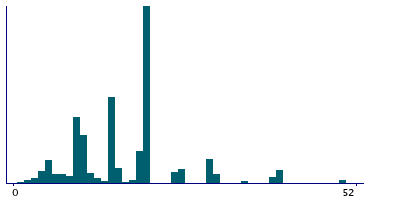
Instance 2 : Imaging visit (2014+)
21,985 participants, 21,985 items
| Maximum | 120 |
| Decile 9 | 25 |
| Decile 8 | 20 |
| Decile 7 | 20 |
| Decile 6 | 20 |
| Median | 15 |
| Decile 4 | 15 |
| Decile 3 | 10 |
| Decile 2 | 10 |
| Decile 1 | 8 |
| Minimum | 1 |
|
|
- There are 44 distinct values.
- Mean = 17.1343
- Std.dev = 8.82394
- 265 items above graph maximum of 42
- 27 items have value -10 (Less than one a day)
- 193 items have value -1 (Do not know)
|
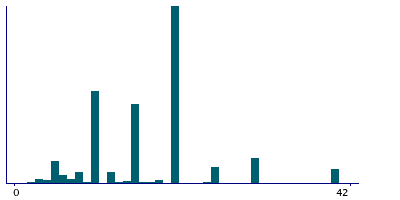
Instance 3 : First repeat imaging visit (2019+)
4,403 participants, 4,403 items
| Maximum | 100 |
| Decile 9 | 25 |
| Decile 8 | 20 |
| Decile 7 | 20 |
| Decile 6 | 20 |
| Median | 15 |
| Decile 4 | 15 |
| Decile 3 | 10 |
| Decile 2 | 10 |
| Decile 1 | 8 |
| Minimum | 1 |
|
|
- There are 34 distinct values.
- Mean = 16.9365
- Std.dev = 8.72977
- 53 items above graph maximum of 42
- 3 items have value -10 (Less than one a day)
- 37 items have value -1 (Do not know)
|
Notes
ACE touchscreen question "About how many cigarettes did you smoke on average each day? "
The following checks were performed:
- If answer < 1 then rejected
- If answer > 150 then rejected
- If answer > 100 then participant asked to confirm
If the participant activated the Help button they were shown the message:
Count the total number of cigarettes (including both hand-rolled and
manufactured cigarettes if both were smoked)
For hand-rolled cigarettes:
- One ounce of tobacco makes about 30 cigarettes
- One gram of tobacco makes about 1 cigarette
|
Field 2887 was collected from participants who indicated that in the past they smoked on most or all days, as defined by their answers to Field 1249 and they smoked manufactured or hand-rolled cigarettes in the past, as defined by their answers to Field 1249
Coding 100353 defines 2 special values:
- -10 represents "Less than one a day"
- -1 represents "Do not know"
2 Related Data-Fields
| Field ID | Description | Relationship |
|---|
| 1249 | Past tobacco smoking | Field 1249 affects who was asked to answer Current Field |
| 2877 | Type of tobacco previously smoked | Field 2877 affects who was asked to answer Current Field |
1 Application
| Application ID | Title |
|---|
| 2482 | Comparisson of smoking behaviour between men and women to assess risk inducing habits |


