Data
218,925 items of data are available, covering 196,731 participants.
Defined-instances run from 0 to 3, labelled using Instancing
2.
Units of measurement are Std.Devs.
| Maximum | 8.413 |
| Decile 9 | 1.238 |
| Decile 8 | 0.626687 |
| Decile 7 | 0.228411 |
| Decile 6 | -0.092 |
| Median | -0.377 |
| Decile 4 | -0.65 |
| Decile 3 | -0.929 |
| Decile 2 | -1.246 |
| Decile 1 | -1.658 |
| Minimum | -5.639 |
|

|
- Mean = -0.252776
- Std.dev = 1.28981
- 426 items below graph minimum of -4.554
- 1807 items above graph maximum of 4.134
|
4 Instances
Instance 0 : Initial assessment visit (2006-2010) at which participants were recruited and consent given
164,025 participants, 164,025 items
| Maximum | 8.413 |
| Decile 9 | 1.225 |
| Decile 8 | 0.611 |
| Decile 7 | 0.214 |
| Decile 6 | -0.108 |
| Median | -0.392 |
| Decile 4 | -0.662 |
| Decile 3 | -0.941 |
| Decile 2 | -1.256 |
| Decile 1 | -1.663 |
| Minimum | -5.639 |
|

|
- Mean = -0.261161
- Std.dev = 1.29975
- 314 items below graph minimum of -4.551
- 1482 items above graph maximum of 4.113
|
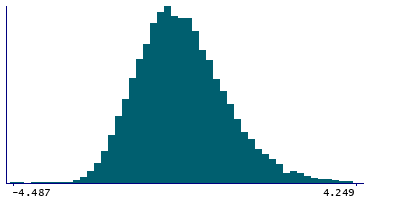
Instance 1 : First repeat assessment visit (2012-13)
19,890 participants, 19,890 items
| Maximum | 8.408 |
| Decile 9 | 1.337 |
| Decile 8 | 0.726 |
| Decile 7 | 0.324 |
| Decile 6 | 0.006 |
| Median | -0.28 |
| Decile 4 | -0.563 |
| Decile 3 | -0.842 |
| Decile 2 | -1.157 |
| Decile 1 | -1.575 |
| Minimum | -5.634 |
|
|
- Mean = -0.170367
- Std.dev = 1.25756
- 41 items below graph minimum of -4.487
- 134 items above graph maximum of 4.249
|
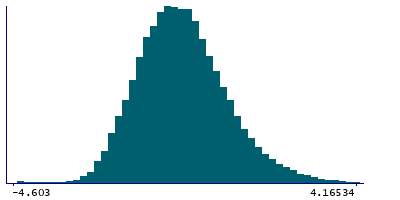
Instance 2 : Imaging visit (2014+)
34,622 participants, 34,622 items
| Maximum | 8.34465 |
| Decile 9 | 1.24217 |
| Decile 8 | 0.639893 |
| Decile 7 | 0.240339 |
| Decile 6 | -0.0717187 |
| Median | -0.356812 |
| Decile 4 | -0.640643 |
| Decile 3 | -0.923402 |
| Decile 2 | -1.24672 |
| Decile 1 | -1.68022 |
| Minimum | -5.56724 |
|
|
- Mean = -0.259278
- Std.dev = 1.26057
- 75 items below graph minimum of -4.60261
- 200 items above graph maximum of 4.16456
|
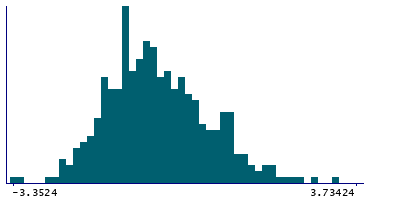
Instance 3 : First repeat imaging visit (2019+)
388 participants, 388 items
| Maximum | 8.00151 |
| Decile 9 | 1.07497 |
| Decile 8 | 0.506643 |
| Decile 7 | 0.131281 |
| Decile 6 | -0.189871 |
| Median | -0.470438 |
| Decile 4 | -0.711415 |
| Decile 3 | -1.00161 |
| Decile 2 | -1.23521 |
| Decile 1 | -1.5843 |
| Minimum | -3.3524 |
|
|
- Mean = -0.352318
- Std.dev = 1.12113
- 1 item above graph maximum of 3.73424
|


