Data
72,817 items of data are available, covering 62,902 participants.
Some values have special meanings defined by Data-Coding
100291.
Defined-instances run from 0 to 3, labelled using Instancing
2.
Units of measurement are glasses.
| Maximum | 48 |
| Decile 9 | 3 |
| Decile 8 | 2 |
| Decile 7 | 1 |
| Decile 6 | 0 |
| Median | 0 |
| Decile 4 | 0 |
| Decile 3 | 0 |
| Decile 2 | 0 |
| Decile 1 | 0 |
| Minimum | 0 |
|
|
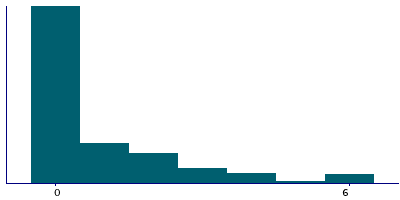
- There are 23 distinct values.
- Mean = 0.97004
- Std.dev = 1.78273
- 786 items above graph maximum of 6
- 95 items have value -3 (Prefer not to answer)
- 592 items have value -1 (Do not know)
|
4 Instances
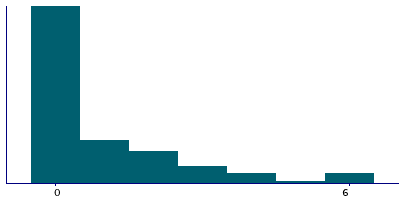
Instance 0 : Initial assessment visit (2006-2010) at which participants were recruited and consent given
40,788 participants, 40,788 items
| Maximum | 48 |
| Decile 9 | 3 |
| Decile 8 | 2 |
| Decile 7 | 1 |
| Decile 6 | 0 |
| Median | 0 |
| Decile 4 | 0 |
| Decile 3 | 0 |
| Decile 2 | 0 |
| Decile 1 | 0 |
| Minimum | 0 |
|

|
- There are 23 distinct values.
- Mean = 0.992203
- Std.dev = 1.83972
- 471 items above graph maximum of 6
- 82 items have value -3 (Prefer not to answer)
- 434 items have value -1 (Do not know)
|
Instance 1 : First repeat assessment visit (2012-13)
4,453 participants, 4,453 items
| Maximum | 18 |
| Decile 9 | 3 |
| Decile 8 | 2 |
| Decile 7 | 1 |
| Decile 6 | 0 |
| Median | 0 |
| Decile 4 | 0 |
| Decile 3 | 0 |
| Decile 2 | 0 |
| Decile 1 | 0 |
| Minimum | 0 |
|
|
- There are 14 distinct values.
- Mean = 1.02642
- Std.dev = 1.79656
- 50 items above graph maximum of 6
- 25 items have value -1 (Do not know)
|
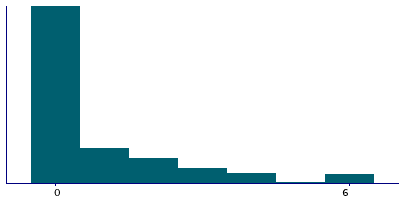
Instance 2 : Imaging visit (2014+)
22,749 participants, 22,749 items
| Maximum | 30 |
| Decile 9 | 3 |
| Decile 8 | 2 |
| Decile 7 | 1 |
| Decile 6 | 0 |
| Median | 0 |
| Decile 4 | 0 |
| Decile 3 | 0 |
| Decile 2 | 0 |
| Decile 1 | 0 |
| Minimum | 0 |
|

|
- There are 18 distinct values.
- Mean = 0.939323
- Std.dev = 1.7037
- 227 items above graph maximum of 6
- 9 items have value -3 (Prefer not to answer)
- 112 items have value -1 (Do not know)
|
Instance 3 : First repeat imaging visit (2019+)
4,827 participants, 4,827 items
| Maximum | 18 |
| Decile 9 | 3 |
| Decile 8 | 2 |
| Decile 7 | 1 |
| Decile 6 | 0 |
| Median | 0 |
| Decile 4 | 0 |
| Decile 3 | 0 |
| Decile 2 | 0 |
| Decile 1 | 0 |
| Minimum | 0 |
|
|
- There are 14 distinct values.
- Mean = 0.876926
- Std.dev = 1.63687
- 38 items above graph maximum of 6
- 4 items have value -3 (Prefer not to answer)
- 21 items have value -1 (Do not know)
|
Notes
ACE touchscreen question "In an average MONTH, how many glasses of RED wine would you drink? (There are six glasses in an average bottle)"
The following checks were performed:
- If answer < 0 then rejected
- If answer > 250 then rejected
- If answer > 10 then participant asked to confirm
If the participant activated the Help button they were shown the message:
Please include sparkling red wine here.
|
Field 4407 was collected from participants who indicated they drink alcohol on special occasions or one to three times a month, as defined by their answers to Field 1558
Coding 100291 defines 2 special values:
- -1 represents "Do not know"
- -3 represents "Prefer not to answer"
1 Related Data-Field
| Field ID | Description | Relationship |
|---|
| 1558 | Alcohol intake frequency. | Current Field was collected from participants who indicated they drink alcohol on special occasions or one to three times a month, as defined by their answers to Field 1558 |
1 Application
| Application ID | Title |
|---|
| 31187 | Integrative Prioritization of Loci for Alcohol Use Disorders and Associated Complex Traits |


