Data
391,406 items of data are available, covering 132,921 participants.
Defined-instances run from 0 to 1, labelled using Instancing
2.
Array indices run from 0 to 15.
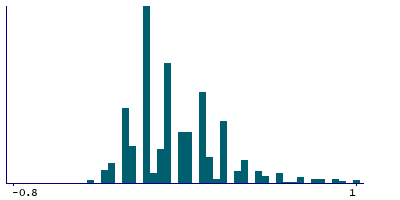
| Maximum | 1.3 |
| Decile 9 | 0.4 |
| Decile 8 | 0.2 |
| Decile 7 | 0.2 |
| Decile 6 | 0.1 |
| Median | 0 |
| Decile 4 | 0 |
| Decile 3 | -0.1 |
| Decile 2 | -0.1 |
| Decile 1 | -0.2 |
| Minimum | -1.1 |
|

|
- Mean = 0.0604605
- Std.dev = 0.252343
- 6 items below graph minimum of -0.8
- 2224 items above graph maximum of 1
|
2 Instances
Instance 0 : Initial assessment visit (2006-2010) at which participants were recruited and consent given
116,954 participants, 332,990 items
| Maximum | 1.3 |
| Decile 9 | 0.4 |
| Decile 8 | 0.2 |
| Decile 7 | 0.2 |
| Decile 6 | 0.1 |
| Median | 0 |
| Decile 4 | 0 |
| Decile 3 | -0.1 |
| Decile 2 | -0.1 |
| Decile 1 | -0.2 |
| Minimum | -1.1 |
|
|
- Mean = 0.0641839
- Std.dev = 0.251591
- 6 items below graph minimum of -0.8
- 1896 items above graph maximum of 1
|
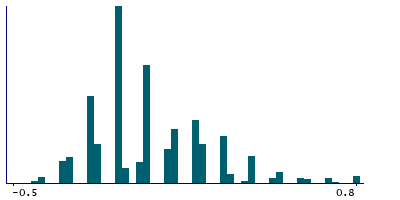
Instance 1 : First repeat assessment visit (2012-13)
20,179 participants, 58,416 items
| Maximum | 1.3 |
| Decile 9 | 0.3 |
| Decile 8 | 0.2 |
| Decile 7 | 0.1 |
| Decile 6 | 0 |
| Median | 0 |
| Decile 4 | -0.1 |
| Decile 3 | -0.1 |
| Decile 2 | -0.2 |
| Decile 1 | -0.2 |
| Minimum | -0.5 |
|
|
- Mean = 0.0392358
- Std.dev = 0.255552
- 883 items above graph maximum of 0.8
|
Notes
Visual acuity (left), logMAR for round
1 Related Data-Field
| Field ID | Description | Relationship |
|---|
| 5079 | logMAR in round (right) | Current Field is the opposite-side complement to Field 5079 |


