Data
356,569 items of data are available, covering 121,831 participants.
Defined-instances run from 0 to 1, labelled using Instancing
2.
Array indices run from 0 to 5.
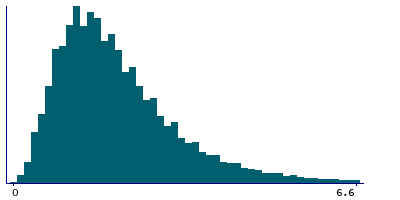
| Maximum | 62.4 |
| Decile 9 | 3.7 |
| Decile 8 | 2.9 |
| Decile 7 | 2.4 |
| Decile 6 | 2.1 |
| Median | 1.8 |
| Decile 4 | 1.5 |
| Decile 3 | 1.3 |
| Decile 2 | 1.1 |
| Decile 1 | 0.8 |
| Minimum | 0 |
|
|
- Mean = 2.09515
- Std.dev = 1.49333
- 5018 items above graph maximum of 6.6
|
2 Instances
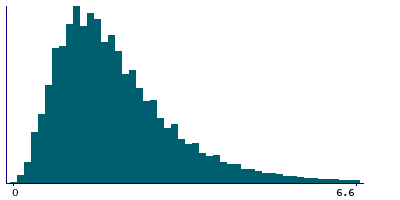
Instance 0 : Initial assessment visit (2006-2010) at which participants were recruited and consent given
107,590 participants, 306,060 items
| Maximum | 62.4 |
| Decile 9 | 3.7 |
| Decile 8 | 2.8 |
| Decile 7 | 2.4 |
| Decile 6 | 2 |
| Median | 1.8 |
| Decile 4 | 1.5 |
| Decile 3 | 1.3 |
| Decile 2 | 1.1 |
| Decile 1 | 0.8 |
| Minimum | 0 |
|
|
- Mean = 2.081
- Std.dev = 1.49367
- 4260 items above graph maximum of 6.6
|
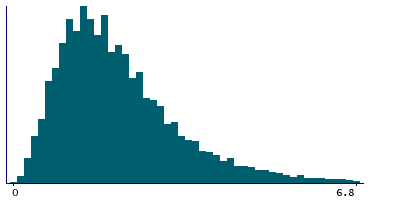
Instance 1 : First repeat assessment visit (2012-13)
17,914 participants, 50,509 items
| Maximum | 53.4 |
| Decile 9 | 3.8 |
| Decile 8 | 3 |
| Decile 7 | 2.5 |
| Decile 6 | 2.2 |
| Median | 1.9 |
| Decile 4 | 1.6 |
| Decile 3 | 1.4 |
| Decile 2 | 1.1 |
| Decile 1 | 0.8 |
| Minimum | 0 |
|
|
- Mean = 2.18085
- Std.dev = 1.48842
- 694 items above graph maximum of 6.8
|
Notes
This is the regularity index as part of the keratometry result taken at 3mm for the right eye
1 Related Data-Field
| Field ID | Description | Relationship |
|---|
| 5163 | 3mm regularity index (left) | Field 5163 is the opposite-side complement to Current Field |


