Data
136,032 items of data are available, covering 131,851 participants.
Defined-instances run from 0 to 1, labelled using Instancing
2.
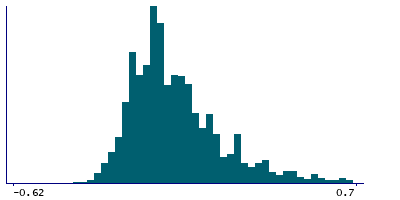
| Maximum | 1.35 |
| Decile 9 | 0.26 |
| Decile 8 | 0.14 |
| Decile 7 | 0.06 |
| Decile 6 | 0.02 |
| Median | -0.04 |
| Decile 4 | -0.06 |
| Decile 3 | -0.1 |
| Decile 2 | -0.14 |
| Decile 1 | -0.18 |
| Minimum | -1.06 |
|
|
- Mean = 0.0209596
- Std.dev = 0.213522
- 2 items below graph minimum of -0.62
- 2483 items above graph maximum of 0.7
|
2 Instances
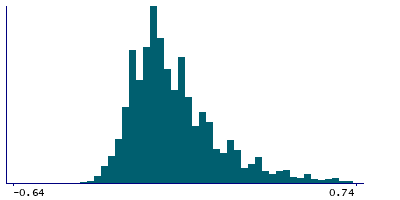
Instance 0 : Initial assessment visit (2006-2010) at which participants were recruited and consent given
115,905 participants, 115,905 items
| Maximum | 1.35 |
| Decile 9 | 0.28 |
| Decile 8 | 0.14 |
| Decile 7 | 0.06 |
| Decile 6 | 0.02 |
| Median | -0.04 |
| Decile 4 | -0.06 |
| Decile 3 | -0.1 |
| Decile 2 | -0.14 |
| Decile 1 | -0.18 |
| Minimum | -1.06 |
|
|
- Mean = 0.0242618
- Std.dev = 0.212699
- 2 items below graph minimum of -0.64
- 1942 items above graph maximum of 0.74
|
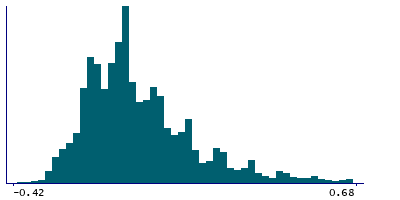
Instance 1 : First repeat assessment visit (2012-13)
20,127 participants, 20,127 items
| Maximum | 1.35 |
| Decile 9 | 0.24 |
| Decile 8 | 0.12 |
| Decile 7 | 0.04 |
| Decile 6 | 0 |
| Median | -0.06 |
| Decile 4 | -0.08 |
| Decile 3 | -0.12 |
| Decile 2 | -0.16 |
| Decile 1 | -0.2 |
| Minimum | -0.42 |
|
|
- Mean = 0.00194281
- Std.dev = 0.217225
- 384 items above graph maximum of 0.68
|


