Data
131,624 items of data are available, covering 127,669 participants.
Defined-instances run from 0 to 1, labelled using Instancing
2.
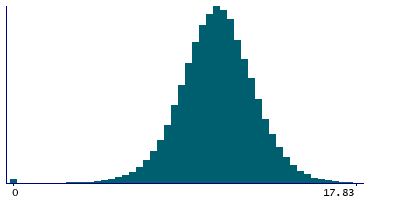
| Maximum | 82.02 |
| Decile 9 | 13.02 |
| Decile 8 | 12.16 |
| Decile 7 | 11.55 |
| Decile 6 | 11.06 |
| Median | 10.61 |
| Decile 4 | 10.15 |
| Decile 3 | 9.65 |
| Decile 2 | 9.06 |
| Decile 1 | 8.21 |
| Minimum | 0 |
|
|
- Mean = 10.6361
- Std.dev = 2.37284
- 534 items above graph maximum of 17.83
|
2 Instances
Instance 0 : Initial assessment visit (2006-2010) at which participants were recruited and consent given
112,133 participants, 112,133 items
| Maximum | 80.1 |
| Decile 9 | 13 |
| Decile 8 | 12.15 |
| Decile 7 | 11.56 |
| Decile 6 | 11.07 |
| Median | 10.62 |
| Decile 4 | 10.17 |
| Decile 3 | 9.68 |
| Decile 2 | 9.1 |
| Decile 1 | 8.26 |
| Minimum | 0 |
|

|
- Mean = 10.6583
- Std.dev = 2.36274
- 463 items above graph maximum of 17.74
|
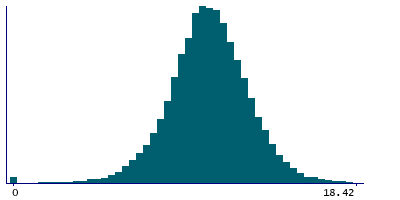
Instance 1 : First repeat assessment visit (2012-13)
19,491 participants, 19,491 items
| Maximum | 82.02 |
| Decile 9 | 13.14 |
| Decile 8 | 12.195 |
| Decile 7 | 11.52 |
| Decile 6 | 10.98 |
| Median | 10.5 |
| Decile 4 | 10 |
| Decile 3 | 9.49 |
| Decile 2 | 8.85 |
| Decile 1 | 7.86 |
| Minimum | 0 |
|
|
- Mean = 10.5085
- Std.dev = 2.42619
- 65 items above graph maximum of 18.42
|


