Data
131,624 items of data are available, covering 127,669 participants.
Defined-instances run from 0 to 1, labelled using Instancing
2.
| Maximum | 76.28 |
| Decile 9 | 13.27 |
| Decile 8 | 12.31 |
| Decile 7 | 11.66 |
| Decile 6 | 11.12 |
| Median | 10.62 |
| Decile 4 | 10.14 |
| Decile 3 | 9.63 |
| Decile 2 | 9.03 |
| Decile 1 | 8.21 |
| Minimum | 0 |
|

|
- Mean = 10.7315
- Std.dev = 2.4499
- 569 items above graph maximum of 18.33
|
2 Instances
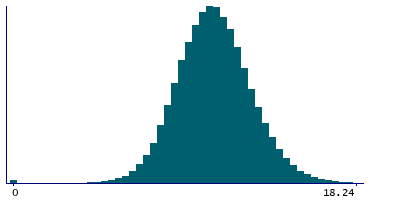
Instance 0 : Initial assessment visit (2006-2010) at which participants were recruited and consent given
112,133 participants, 112,133 items
| Maximum | 74.7 |
| Decile 9 | 13.24 |
| Decile 8 | 12.29 |
| Decile 7 | 11.65 |
| Decile 6 | 11.12 |
| Median | 10.63 |
| Decile 4 | 10.15 |
| Decile 3 | 9.64 |
| Decile 2 | 9.05 |
| Decile 1 | 8.24 |
| Minimum | 0 |
|
|
- Mean = 10.7383
- Std.dev = 2.44596
- 486 items above graph maximum of 18.24
|
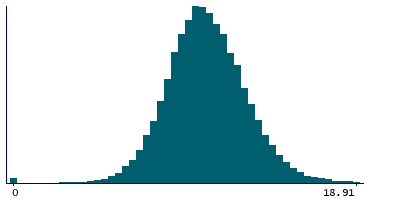
Instance 1 : First repeat assessment visit (2012-13)
19,491 participants, 19,491 items
| Maximum | 76.28 |
| Decile 9 | 13.46 |
| Decile 8 | 12.42 |
| Decile 7 | 11.7 |
| Decile 6 | 11.11 |
| Median | 10.57 |
| Decile 4 | 10.05 |
| Decile 3 | 9.52 |
| Decile 2 | 8.9 |
| Decile 1 | 8.01 |
| Minimum | 0 |
|
|
- Mean = 10.6929
- Std.dev = 2.47203
- 70 items above graph maximum of 18.91
|


