Data
128,217 items of data are available, covering 124,406 participants.
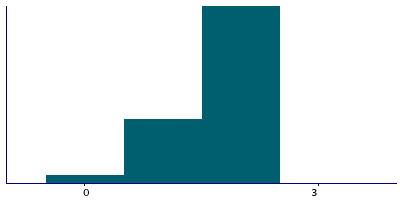
Defined-instances run from 0 to 1, labelled using Instancing
2.
| Maximum | 5 |
| Decile 9 | 2 |
| Decile 8 | 2 |
| Decile 7 | 2 |
| Decile 6 | 2 |
| Median | 2 |
| Decile 4 | 2 |
| Decile 3 | 2 |
| Decile 2 | 1 |
| Decile 1 | 1 |
| Minimum | 0 |
|

|
- There are 6 distinct values.
- Mean = 1.7058
- Std.dev = 0.595495
- 1056 items above graph maximum of 3
|
2 Instances
Instance 0 : Initial assessment visit (2006-2010) at which participants were recruited and consent given
109,829 participants, 109,829 items
| Maximum | 5 |
| Decile 9 | 2 |
| Decile 8 | 2 |
| Decile 7 | 2 |
| Decile 6 | 2 |
| Median | 2 |
| Decile 4 | 2 |
| Decile 3 | 2 |
| Decile 2 | 1 |
| Decile 1 | 1 |
| Minimum | 0 |
|

|
- There are 6 distinct values.
- Mean = 1.70631
- Std.dev = 0.595539
- 907 items above graph maximum of 3
|
Instance 1 : First repeat assessment visit (2012-13)
18,388 participants, 18,388 items
| Maximum | 5 |
| Decile 9 | 2 |
| Decile 8 | 2 |
| Decile 7 | 2 |
| Decile 6 | 2 |
| Median | 2 |
| Decile 4 | 2 |
| Decile 3 | 2 |
| Decile 2 | 1 |
| Decile 1 | 1 |
| Minimum | 0 |
|
|
- There are 6 distinct values.
- Mean = 1.7028
- Std.dev = 0.595227
- 149 items above graph maximum of 3
|


