Data
16,803 items of data are available, covering 16,121 participants.
Defined-instances run from 2 to 3, labelled using Instancing
2.
Units of measurement are dioptre.
| Maximum | 13 |
| Decile 9 | 3.25 |
| Decile 8 | 2.25 |
| Decile 7 | 1.75 |
| Decile 6 | 1.25 |
| Median | 1 |
| Decile 4 | 0.5 |
| Decile 3 | 0 |
| Decile 2 | -0.75 |
| Decile 1 | -2 |
| Minimum | -17.5 |
|
|
- Mean = 0.70358
- Std.dev = 2.42972
- 154 items below graph minimum of -7.25
- 34 items above graph maximum of 8.5
|
2 Instances
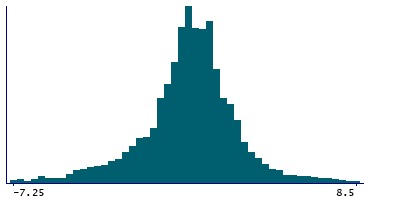
Instance 2 : Imaging visit (2014+)
3,498 participants, 3,498 items
| Maximum | 10 |
| Decile 9 | 3.25 |
| Decile 8 | 2.25 |
| Decile 7 | 1.75 |
| Decile 6 | 1.25 |
| Median | 1 |
| Decile 4 | 0.5 |
| Decile 3 | 0.25 |
| Decile 2 | -0.5 |
| Decile 1 | -2 |
| Minimum | -14.25 |
|

|
- Mean = 0.796241
- Std.dev = 2.42074
- 26 items below graph minimum of -7.25
- 6 items above graph maximum of 8.5
|
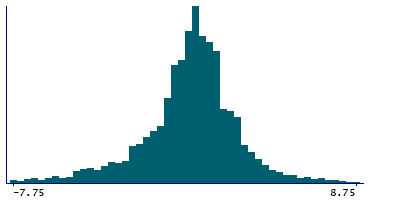
Instance 3 : First repeat imaging visit (2019+)
13,305 participants, 13,305 items
| Maximum | 13 |
| Decile 9 | 3 |
| Decile 8 | 2.25 |
| Decile 7 | 1.75 |
| Decile 6 | 1.25 |
| Median | 0.875 |
| Decile 4 | 0.5 |
| Decile 3 | 0 |
| Decile 2 | -0.75 |
| Decile 1 | -2.25 |
| Minimum | -17.5 |
|
|
- Mean = 0.679218
- Std.dev = 2.4315
- 113 items below graph minimum of -7.5
- 32 items above graph maximum of 8.25
|
Notes
Left eye prescription is defined here as Median spherical equivalent value (left) + 0.75
0 Related Data-Fields
There are no related data-fields
0 Resources
There are no matching Resources
