Data
333,864 items of data are available, covering 288,973 participants.
Some values have special meanings defined by Data-Coding
100291.
Defined-instances run from 0 to 3, labelled using Instancing
2.
Units of measurement are hours.
| Maximum | 160 |
| Decile 9 | 50 |
| Decile 8 | 45 |
| Decile 7 | 40 |
| Decile 6 | 40 |
| Median | 37 |
| Decile 4 | 35 |
| Decile 3 | 30 |
| Decile 2 | 23 |
| Decile 1 | 16 |
| Minimum | 0 |
|
|
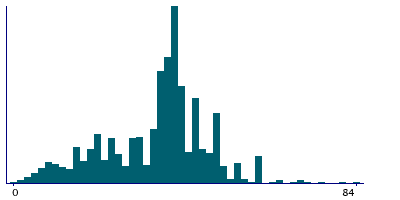
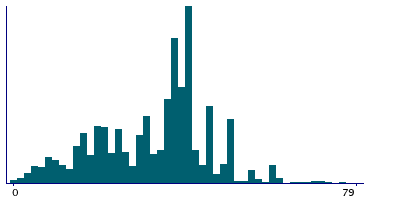
- There are 121 distinct values.
- Mean = 34.8262
- Std.dev = 12.8961
- 304 items above graph maximum of 84
- 1604 items have value -3 (Prefer not to answer)
- 3447 items have value -1 (Do not know)
|
4 Instances
Instance 0 : Initial assessment visit (2006-2010) at which participants were recruited and consent given
286,767 participants, 286,767 items
| Maximum | 160 |
| Decile 9 | 50 |
| Decile 8 | 45 |
| Decile 7 | 40 |
| Decile 6 | 40 |
| Median | 37 |
| Decile 4 | 36 |
| Decile 3 | 30 |
| Decile 2 | 24 |
| Decile 1 | 16 |
| Minimum | 0 |
|
|
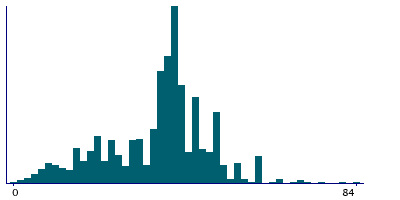
- There are 119 distinct values.
- Mean = 35.2833
- Std.dev = 12.7295
- 263 items above graph maximum of 84
- 1402 items have value -3 (Prefer not to answer)
- 2850 items have value -1 (Do not know)
|
Instance 1 : First repeat assessment visit (2012-13)
8,292 participants, 8,292 items
| Maximum | 156 |
| Decile 9 | 50 |
| Decile 8 | 44 |
| Decile 7 | 40 |
| Decile 6 | 39 |
| Median | 37 |
| Decile 4 | 35 |
| Decile 3 | 28 |
| Decile 2 | 20 |
| Decile 1 | 14 |
| Minimum | 0 |
|
|
- There are 75 distinct values.
- Mean = 33.3461
- Std.dev = 13.5
- 8 items above graph maximum of 86
- 27 items have value -3 (Prefer not to answer)
- 86 items have value -1 (Do not know)
|
Instance 2 : Imaging visit (2014+)
33,398 participants, 33,398 items
| Maximum | 160 |
| Decile 9 | 47 |
| Decile 8 | 40 |
| Decile 7 | 40 |
| Decile 6 | 37 |
| Median | 35 |
| Decile 4 | 30 |
| Decile 3 | 24 |
| Decile 2 | 20 |
| Decile 1 | 12 |
| Minimum | 0 |
|
|
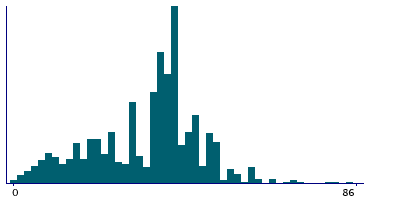
- There are 91 distinct values.
- Mean = 31.8676
- Std.dev = 13.5442
- 51 items above graph maximum of 82
- 154 items have value -3 (Prefer not to answer)
- 454 items have value -1 (Do not know)
|
Instance 3 : First repeat imaging visit (2019+)
5,407 participants, 5,407 items
| Maximum | 120 |
| Decile 9 | 45 |
| Decile 8 | 40 |
| Decile 7 | 40 |
| Decile 6 | 37 |
| Median | 35 |
| Decile 4 | 30 |
| Decile 3 | 23 |
| Decile 2 | 19 |
| Decile 1 | 12 |
| Minimum | 0 |
|
|
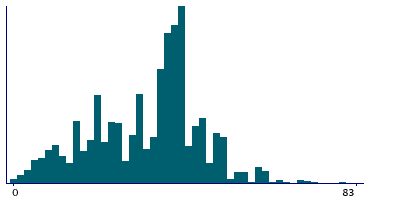
- There are 74 distinct values.
- Mean = 31.0711
- Std.dev = 13.4287
- 15 items above graph maximum of 78
- 21 items have value -3 (Prefer not to answer)
- 57 items have value -1 (Do not know)
|
Notes
ACE touchscreen question "In a typical WEEK, how many hours do you spend at work? (Do not include hours travelling to and from work)"
The following checks were performed:
- If answer > 160 then rejected
- If answer < 1 then participant asked to confirm
- If answer > 74 then participant asked to confirm
If the participant activated the Help button they were shown the message:
If you have more than one 'current job' then answer this question
for your MAIN job only.
|
Field 767 was collected from all the participants who indicated they were in paid employment or self-employed, as defined by their answers to Field 6142
Coding 100291 defines 2 special values:
- -1 represents "Do not know"
- -3 represents "Prefer not to answer"
1 Related Data-Field
| Field ID | Description | Relationship |
|---|
| 6142 | Current employment status | Current Field was collected from all the participants who indicated they were in paid employment or self-employed, as defined by their answers to Field 6142 |
1 Application
| Application ID | Title |
|---|
| 20684 | Understanding the associations between environmental exposures, health behaviours and health outcomes |


