Data
507,960 items of data are available, covering 488,512 participants.
Defined-instances run from 0 to 1, labelled using Instancing
2.
Units of measurement are mmol/l.
| Maximum | 7.2255 |
| Decile 9 | 3.5915 |
| Decile 8 | 3.36319 |
| Decile 7 | 3.2051 |
| Decile 6 | 3.0741 |
| Median | 2.9544 |
| Decile 4 | 2.83713 |
| Decile 3 | 2.71338 |
| Decile 2 | 2.5711 |
| Decile 1 | 2.3763 |
| Minimum | 0.59692 |
|

|
- Mean = 2.97423
- Std.dev = 0.4831
- 614 items above graph maximum of 4.8067
|
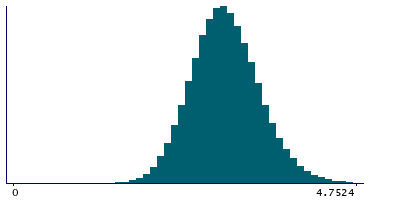
2 Instances
Instance 0 : Initial assessment visit (2006-2010) at which participants were recruited and consent given
488,083 participants, 488,083 items
| Maximum | 7.2255 |
| Decile 9 | 3.5906 |
| Decile 8 | 3.362 |
| Decile 7 | 3.2039 |
| Decile 6 | 3.07312 |
| Median | 2.95355 |
| Decile 4 | 2.8366 |
| Decile 3 | 2.71309 |
| Decile 2 | 2.57129 |
| Decile 1 | 2.3768 |
| Minimum | 0.59692 |
|
|
- Mean = 2.97371
- Std.dev = 0.482417
- 582 items above graph maximum of 4.8044
|
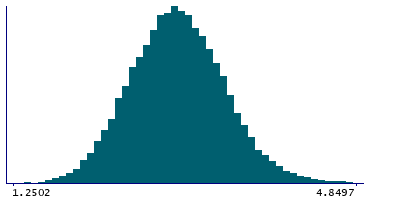
Instance 1 : First repeat assessment visit (2012-13)
19,877 participants, 19,877 items
| Maximum | 6.13738 |
| Decile 9 | 3.61255 |
| Decile 8 | 3.39275 |
| Decile 7 | 3.23448 |
| Decile 6 | 3.09789 |
| Median | 2.97435 |
| Decile 4 | 2.8528 |
| Decile 3 | 2.72246 |
| Decile 2 | 2.5657 |
| Decile 1 | 2.3625 |
| Minimum | 1.2502 |
|
|
- Mean = 2.98708
- Std.dev = 0.499421
- 30 items above graph maximum of 4.8626
|


