Data
507,960 items of data are available, covering 488,512 participants.
Defined-instances run from 0 to 1, labelled using Instancing
2.
Units of measurement are mmol/l.
| Maximum | 2.01268 |
| Decile 9 | 0.804763 |
| Decile 8 | 0.734622 |
| Decile 7 | 0.68681 |
| Decile 6 | 0.646885 |
| Median | 0.6106 |
| Decile 4 | 0.57531 |
| Decile 3 | 0.538511 |
| Decile 2 | 0.496833 |
| Decile 1 | 0.44193 |
| Minimum | 0.0992557 |
|
|
- Mean = 0.618654
- Std.dev = 0.1435
- 509 items above graph maximum of 1.1676
|
2 Instances
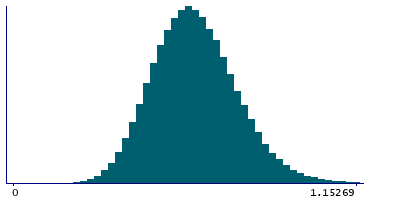
Instance 0 : Initial assessment visit (2006-2010) at which participants were recruited and consent given
488,083 participants, 488,083 items
| Maximum | 2.01268 |
| Decile 9 | 0.805232 |
| Decile 8 | 0.735074 |
| Decile 7 | 0.68722 |
| Decile 6 | 0.647342 |
| Median | 0.611087 |
| Decile 4 | 0.57578 |
| Decile 3 | 0.538923 |
| Decile 2 | 0.497333 |
| Decile 1 | 0.442436 |
| Minimum | 0.0992557 |
|

|
- Mean = 0.619117
- Std.dev = 0.143483
- 483 items above graph maximum of 1.16803
|
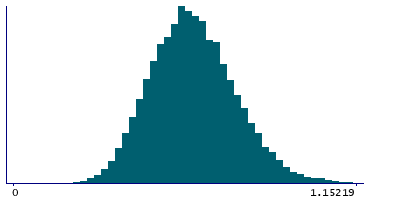
Instance 1 : First repeat assessment visit (2012-13)
19,877 participants, 19,877 items
| Maximum | 1.42051 |
| Decile 9 | 0.792428 |
| Decile 8 | 0.72359 |
| Decile 7 | 0.67614 |
| Decile 6 | 0.635144 |
| Median | 0.598869 |
| Decile 4 | 0.564934 |
| Decile 3 | 0.527795 |
| Decile 2 | 0.484155 |
| Decile 1 | 0.429445 |
| Minimum | 0.15852 |
|
|
- Mean = 0.607274
- Std.dev = 0.143437
- 27 items above graph maximum of 1.15541
|


