Data
507,960 items of data are available, covering 488,512 participants.
Defined-instances run from 0 to 1, labelled using Instancing
2.
Units of measurement are mmol/l.
| Maximum | 8.45144 |
| Decile 9 | 3.3419 |
| Decile 8 | 3.0386 |
| Decile 7 | 2.83254 |
| Decile 6 | 2.6611 |
| Median | 2.5071 |
| Decile 4 | 2.3581 |
| Decile 3 | 2.20233 |
| Decile 2 | 2.026 |
| Decile 1 | 1.7944 |
| Minimum | 0.203877 |
|
|
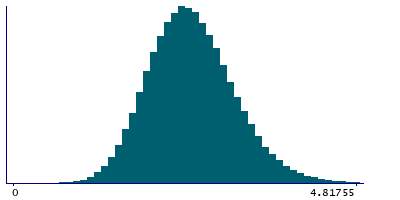
- Mean = 2.54522
- Std.dev = 0.613944
- 573 items above graph maximum of 4.8894
|
2 Instances
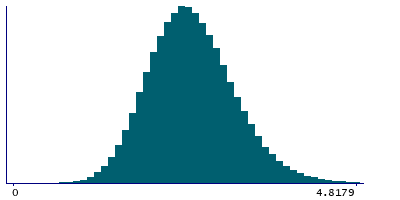
Instance 0 : Initial assessment visit (2006-2010) at which participants were recruited and consent given
488,083 participants, 488,083 items
| Maximum | 8.45144 |
| Decile 9 | 3.3443 |
| Decile 8 | 3.04042 |
| Decile 7 | 2.83436 |
| Decile 6 | 2.6629 |
| Median | 2.5088 |
| Decile 4 | 2.35978 |
| Decile 3 | 2.20408 |
| Decile 2 | 2.028 |
| Decile 1 | 1.7967 |
| Minimum | 0.203877 |
|
|
- Mean = 2.54706
- Std.dev = 0.613879
- 542 items above graph maximum of 4.8919
|
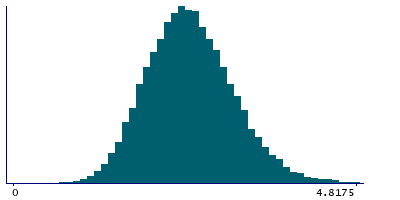
Instance 1 : First repeat assessment visit (2012-13)
19,877 participants, 19,877 items
| Maximum | 6.09124 |
| Decile 9 | 3.28892 |
| Decile 8 | 2.99295 |
| Decile 7 | 2.79215 |
| Decile 6 | 2.61624 |
| Median | 2.46361 |
| Decile 4 | 2.31638 |
| Decile 3 | 2.16105 |
| Decile 2 | 1.9784 |
| Decile 1 | 1.7458 |
| Minimum | 0.42495 |
|
|
- Mean = 2.50013
- Std.dev = 0.613818
- 30 items above graph maximum of 4.83204
|


