Data
507,960 items of data are available, covering 488,512 participants.
Defined-instances run from 0 to 1, labelled using Instancing
2.
Units of measurement are mmol/l.
| Maximum | 0.0434674 |
| Decile 9 | 0.0205165 |
| Decile 8 | 0.019253 |
| Decile 7 | 0.018396 |
| Decile 6 | 0.0176872 |
| Median | 0.017049 |
| Decile 4 | 0.016421 |
| Decile 3 | 0.015766 |
| Decile 2 | 0.0150127 |
| Decile 1 | 0.0139992 |
| Minimum | 0.0037766 |
|
|
- Mean = 0.017181
- Std.dev = 0.00261403
- 34 items below graph minimum of 0.00748182
- 821 items above graph maximum of 0.0270339
|
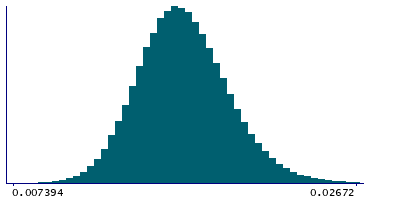
2 Instances
Instance 0 : Initial assessment visit (2006-2010) at which participants were recruited and consent given
488,083 participants, 488,083 items
| Maximum | 0.0434674 |
| Decile 9 | 0.020509 |
| Decile 8 | 0.019246 |
| Decile 7 | 0.0183888 |
| Decile 6 | 0.0176807 |
| Median | 0.017042 |
| Decile 4 | 0.016416 |
| Decile 3 | 0.0157619 |
| Decile 2 | 0.0150091 |
| Decile 1 | 0.013997 |
| Minimum | 0.0037766 |
|

|
- Mean = 0.0171754
- Std.dev = 0.00261081
- 33 items below graph minimum of 0.007485
- 770 items above graph maximum of 0.027021
|
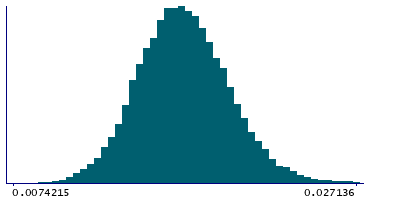
Instance 1 : First repeat assessment visit (2012-13)
19,877 participants, 19,877 items
| Maximum | 0.037466 |
| Decile 9 | 0.020683 |
| Decile 8 | 0.019442 |
| Decile 7 | 0.018576 |
| Decile 6 | 0.017854 |
| Median | 0.0171992 |
| Decile 4 | 0.016544 |
| Decile 3 | 0.015878 |
| Decile 2 | 0.0150913 |
| Decile 1 | 0.0140641 |
| Minimum | 0.0066553 |
|
|
- Mean = 0.0173173
- Std.dev = 0.00268822
- 1 item below graph minimum of 0.00744526
- 54 items above graph maximum of 0.0273019
|


