Data
507,960 items of data are available, covering 488,512 participants.
Defined-instances run from 0 to 1, labelled using Instancing
2.
Units of measurement are nm.
| Maximum | 10.884 |
| Decile 9 | 9.9293 |
| Decile 8 | 9.8104 |
| Decile 7 | 9.7277 |
| Decile 6 | 9.66067 |
| Median | 9.6042 |
| Decile 4 | 9.5545 |
| Decile 3 | 9.50803 |
| Decile 2 | 9.4604 |
| Decile 1 | 9.4025 |
| Minimum | 9.0397 |
|
|
- Mean = 9.639
- Std.dev = 0.20708
- 302 items above graph maximum of 10.4561
|
2 Instances
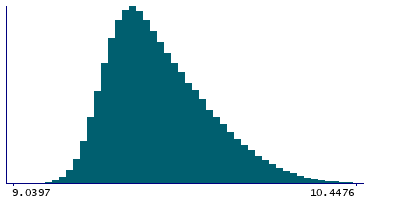
Instance 0 : Initial assessment visit (2006-2010) at which participants were recruited and consent given
488,083 participants, 488,083 items
| Maximum | 10.884 |
| Decile 9 | 9.9272 |
| Decile 8 | 9.8085 |
| Decile 7 | 9.72599 |
| Decile 6 | 9.659 |
| Median | 9.6027 |
| Decile 4 | 9.5532 |
| Decile 3 | 9.5069 |
| Decile 2 | 9.4594 |
| Decile 1 | 9.4017 |
| Minimum | 9.0397 |
|

|
- Mean = 9.63761
- Std.dev = 0.206745
- 304 items above graph maximum of 10.4527
|
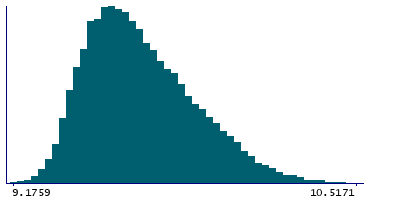
Instance 1 : First repeat assessment visit (2012-13)
19,877 participants, 19,877 items
| Maximum | 10.695 |
| Decile 9 | 9.97365 |
| Decile 8 | 9.85275 |
| Decile 7 | 9.77031 |
| Decile 6 | 9.70035 |
| Median | 9.641 |
| Decile 4 | 9.5887 |
| Decile 3 | 9.53835 |
| Decile 2 | 9.4861 |
| Decile 1 | 9.425 |
| Minimum | 9.1759 |
|
|
- Mean = 9.67332
- Std.dev = 0.212284
- 4 items above graph maximum of 10.5223
|


