Data
507,328 items of data are available, covering 487,914 participants.
Defined-instances run from 0 to 1, labelled using Instancing
2.
Units of measurement are degree.
| Maximum | 3.0419 |
| Decile 9 | 1.4563 |
| Decile 8 | 1.4208 |
| Decile 7 | 1.3968 |
| Decile 6 | 1.3767 |
| Median | 1.3579 |
| Decile 4 | 1.33882 |
| Decile 3 | 1.3179 |
| Decile 2 | 1.2922 |
| Decile 1 | 1.25506 |
| Minimum | 0.85539 |
|
|
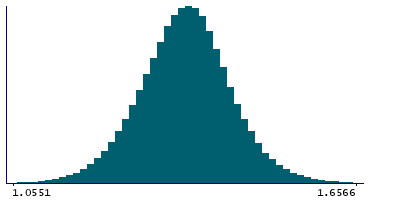
- Mean = 1.35709
- Std.dev = 0.0814434
- 166 items below graph minimum of 1.05382
- 642 items above graph maximum of 1.65754
|
2 Instances
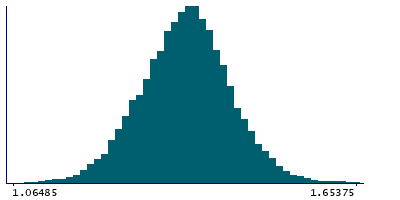
Instance 0 : Initial assessment visit (2006-2010) at which participants were recruited and consent given
487,463 participants, 487,463 items
| Maximum | 3.0419 |
| Decile 9 | 1.45625 |
| Decile 8 | 1.4207 |
| Decile 7 | 1.39661 |
| Decile 6 | 1.3765 |
| Median | 1.3577 |
| Decile 4 | 1.33863 |
| Decile 3 | 1.3177 |
| Decile 2 | 1.29199 |
| Decile 1 | 1.2548 |
| Minimum | 0.85539 |
|

|
- Mean = 1.35692
- Std.dev = 0.0815508
- 158 items below graph minimum of 1.05335
- 620 items above graph maximum of 1.65771
|
Instance 1 : First repeat assessment visit (2012-13)
19,865 participants, 19,865 items
| Maximum | 1.86871 |
| Decile 9 | 1.4578 |
| Decile 8 | 1.4233 |
| Decile 7 | 1.40022 |
| Decile 6 | 1.3805 |
| Median | 1.3623 |
| Decile 4 | 1.3433 |
| Decile 3 | 1.3229 |
| Decile 2 | 1.2979 |
| Decile 1 | 1.2615 |
| Minimum | 0.992899 |
|
|
- Mean = 1.36122
- Std.dev = 0.0786484
- 6 items below graph minimum of 1.0652
- 21 items above graph maximum of 1.6541
|


