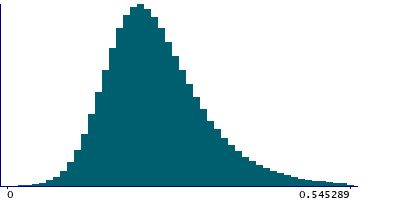
Data
507,327 items of data are available, covering 487,913 participants.
Defined-instances run from 0 to 1, labelled using Instancing
2.
Units of measurement are mmol/l.
| Maximum | 2.61291 |
| Decile 9 | 0.346174 |
| Decile 8 | 0.29876 |
| Decile 7 | 0.269444 |
| Decile 6 | 0.24686 |
| Median | 0.227647 |
| Decile 4 | 0.20984 |
| Decile 3 | 0.19214 |
| Decile 2 | 0.172653 |
| Decile 1 | 0.147059 |
| Minimum | 0.0002518 |
|
|
- Mean = 0.239932
- Std.dev = 0.0855248
- 3344 items above graph maximum of 0.545289
|
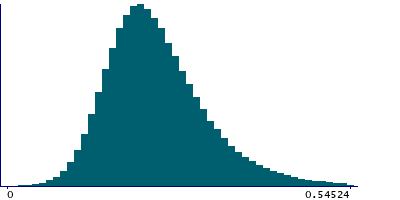
2 Instances
Instance 0 : Initial assessment visit (2006-2010) at which participants were recruited and consent given
487,462 participants, 487,462 items
| Maximum | 2.61291 |
| Decile 9 | 0.34611 |
| Decile 8 | 0.29862 |
| Decile 7 | 0.26928 |
| Decile 6 | 0.24673 |
| Median | 0.227523 |
| Decile 4 | 0.209732 |
| Decile 3 | 0.19205 |
| Decile 2 | 0.17257 |
| Decile 1 | 0.14698 |
| Minimum | 0.0002518 |
|
|
- Mean = 0.239827
- Std.dev = 0.0855525
- 3216 items above graph maximum of 0.54524
|
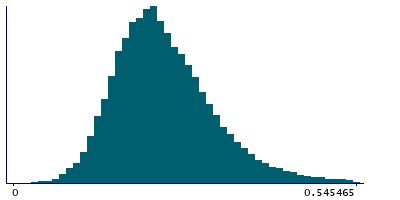
Instance 1 : First repeat assessment visit (2012-13)
19,865 participants, 19,865 items
| Maximum | 1.053 |
| Decile 9 | 0.34834 |
| Decile 8 | 0.301952 |
| Decile 7 | 0.273295 |
| Decile 6 | 0.25045 |
| Median | 0.23054 |
| Decile 4 | 0.21283 |
| Decile 3 | 0.19461 |
| Decile 2 | 0.17483 |
| Decile 1 | 0.149272 |
| Minimum | 0.0051234 |
|
|
- Mean = 0.242526
- Std.dev = 0.0848
- 126 items above graph maximum of 0.547408
|


