Data
507,327 items of data are available, covering 487,913 participants.
Defined-instances run from 0 to 1, labelled using Instancing
2.
Units of measurement are percent.
| Maximum | 39.6496 |
| Decile 9 | 27.4968 |
| Decile 8 | 26.0414 |
| Decile 7 | 25.0493 |
| Decile 6 | 24.249 |
| Median | 23.558 |
| Decile 4 | 22.9102 |
| Decile 3 | 22.26 |
| Decile 2 | 21.547 |
| Decile 1 | 20.621 |
| Minimum | 2.8437e-05 |
|
|
- Mean = 23.8367
- Std.dev = 2.69912
- 6 items below graph minimum of 13.7452
- 268 items above graph maximum of 34.3725
|
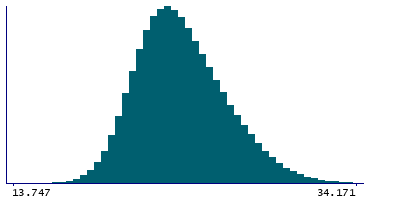
2 Instances
Instance 0 : Initial assessment visit (2006-2010) at which participants were recruited and consent given
487,462 participants, 487,462 items
| Maximum | 39.6496 |
| Decile 9 | 27.5038 |
| Decile 8 | 26.0469 |
| Decile 7 | 25.051 |
| Decile 6 | 24.248 |
| Median | 23.555 |
| Decile 4 | 22.9053 |
| Decile 3 | 22.2546 |
| Decile 2 | 21.54 |
| Decile 1 | 20.613 |
| Minimum | 2.8437e-05 |
|

|
- Mean = 23.8353
- Std.dev = 2.70557
- 6 items below graph minimum of 13.7222
- 256 items above graph maximum of 34.3945
|
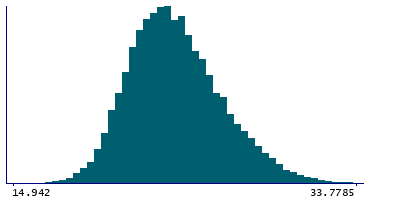
Instance 1 : First repeat assessment visit (2012-13)
19,865 participants, 19,865 items
| Maximum | 37.0625 |
| Decile 9 | 27.3003 |
| Decile 8 | 25.926 |
| Decile 7 | 25.018 |
| Decile 6 | 24.276 |
| Median | 23.6325 |
| Decile 4 | 23.023 |
| Decile 3 | 22.3925 |
| Decile 2 | 21.714 |
| Decile 1 | 20.8285 |
| Minimum | 14.8432 |
|
|
- Mean = 23.87
- Std.dev = 2.53543
- 9 items above graph maximum of 33.772
|


