Data
507,326 items of data are available, covering 487,912 participants.
Defined-instances run from 0 to 1, labelled using Instancing
2.
Units of measurement are ratio.
| Maximum | 6.8721 |
| Decile 9 | 2.2338 |
| Decile 8 | 2.09205 |
| Decile 7 | 1.9886 |
| Decile 6 | 1.8993 |
| Median | 1.81256 |
| Decile 4 | 1.7236 |
| Decile 3 | 1.6255 |
| Decile 2 | 1.5097 |
| Decile 1 | 1.35287 |
| Minimum | 0.56141 |
|

|
- Mean = 1.80507
- Std.dev = 0.342775
- 241 items above graph maximum of 3.11473
|
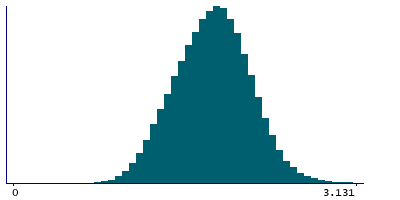
2 Instances
Instance 0 : Initial assessment visit (2006-2010) at which participants were recruited and consent given
487,461 participants, 487,461 items
| Maximum | 6.8721 |
| Decile 9 | 2.2356 |
| Decile 8 | 2.0934 |
| Decile 7 | 1.9898 |
| Decile 6 | 1.9001 |
| Median | 1.8131 |
| Decile 4 | 1.7238 |
| Decile 3 | 1.6253 |
| Decile 2 | 1.509 |
| Decile 1 | 1.35191 |
| Minimum | 0.56141 |
|
|
- Mean = 1.80552
- Std.dev = 0.343759
- 229 items above graph maximum of 3.11929
|
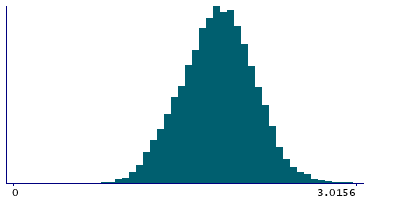
Instance 1 : First repeat assessment visit (2012-13)
19,865 participants, 19,865 items
| Maximum | 3.59968 |
| Decile 9 | 2.1925 |
| Decile 8 | 2.05888 |
| Decile 7 | 1.9617 |
| Decile 6 | 1.88085 |
| Median | 1.8 |
| Decile 4 | 1.71893 |
| Decile 3 | 1.6326 |
| Decile 2 | 1.5242 |
| Decile 1 | 1.37478 |
| Minimum | 0.614933 |
|
|
- Mean = 1.79401
- Std.dev = 0.317478
- 10 items above graph maximum of 3.01022
|


