Data
507,298 items of data are available, covering 487,884 participants.
Defined-instances run from 0 to 1, labelled using Instancing
2.
Units of measurement are ratio.
| Maximum | 253.64 |
| Decile 9 | 14.4569 |
| Decile 8 | 12.1375 |
| Decile 7 | 10.801 |
| Decile 6 | 9.81141 |
| Median | 8.98689 |
| Decile 4 | 8.2495 |
| Decile 3 | 7.523 |
| Decile 2 | 6.7553 |
| Decile 1 | 5.78972 |
| Minimum | 0.953124 |
|

|
- Mean = 9.78671
- Std.dev = 4.35086
- 6407 items above graph maximum of 23.1241
|
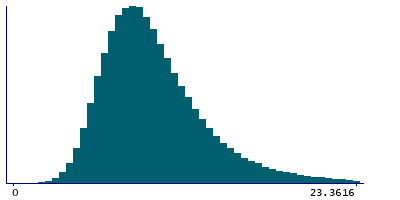
2 Instances
Instance 0 : Initial assessment visit (2006-2010) at which participants were recruited and consent given
487,433 participants, 487,433 items
| Maximum | 253.64 |
| Decile 9 | 14.4713 |
| Decile 8 | 12.149 |
| Decile 7 | 10.8121 |
| Decile 6 | 9.82233 |
| Median | 8.9965 |
| Decile 4 | 8.25847 |
| Decile 3 | 7.53062 |
| Decile 2 | 6.7601 |
| Decile 1 | 5.79214 |
| Minimum | 0.953124 |
|
|
- Mean = 9.79499
- Std.dev = 4.35412
- 6134 items above graph maximum of 23.1504
|
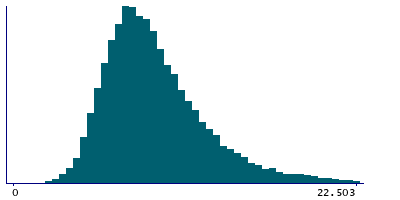
Instance 1 : First repeat assessment visit (2012-13)
19,865 participants, 19,865 items
| Maximum | 170.69 |
| Decile 9 | 14.1445 |
| Decile 8 | 11.853 |
| Decile 7 | 10.529 |
| Decile 6 | 9.55 |
| Median | 8.76565 |
| Decile 4 | 8.0353 |
| Decile 3 | 7.3803 |
| Decile 2 | 6.6436 |
| Decile 1 | 5.72608 |
| Minimum | 1.68563 |
|
|
- Mean = 9.58372
- Std.dev = 4.26521
- 273 items above graph maximum of 22.5629
|


