Data
507,960 items of data are available, covering 488,512 participants.
Defined-instances run from 0 to 1, labelled using Instancing
2.
Units of measurement are mmol/l.
| Maximum | 0.665888 |
| Decile 9 | 0.1148 |
| Decile 8 | 0.08816 |
| Decile 7 | 0.0703845 |
| Decile 6 | 0.0567628 |
| Median | 0.0453757 |
| Decile 4 | 0.035534 |
| Decile 3 | 0.026646 |
| Decile 2 | 0.01802 |
| Decile 1 | 0.008718 |
| Minimum | 9.67627e-05 |
|

|
- Mean = 0.0554424
- Std.dev = 0.0437154
- 2297 items above graph maximum of 0.220882
|
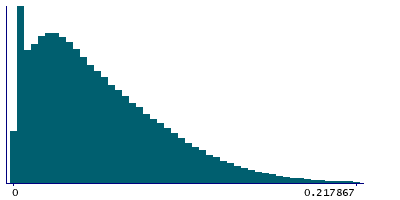
2 Instances
Instance 0 : Initial assessment visit (2006-2010) at which participants were recruited and consent given
488,083 participants, 488,083 items
| Maximum | 0.665888 |
| Decile 9 | 0.115124 |
| Decile 8 | 0.088428 |
| Decile 7 | 0.070601 |
| Decile 6 | 0.056897 |
| Median | 0.04547 |
| Decile 4 | 0.035574 |
| Decile 3 | 0.0266639 |
| Decile 2 | 0.018006 |
| Decile 1 | 0.00867955 |
| Minimum | 9.67627e-05 |
|
|
- Mean = 0.0555757
- Std.dev = 0.0438709
- 2205 items above graph maximum of 0.221568
|
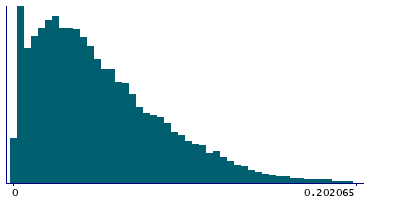
Instance 1 : First repeat assessment visit (2012-13)
19,877 participants, 19,877 items
| Maximum | 0.405032 |
| Decile 9 | 0.106137 |
| Decile 8 | 0.08201 |
| Decile 7 | 0.065865 |
| Decile 6 | 0.053832 |
| Median | 0.0434773 |
| Decile 4 | 0.0346655 |
| Decile 3 | 0.0263228 |
| Decile 2 | 0.01836 |
| Decile 1 | 0.0095121 |
| Minimum | 0.000694 |
|
|
- Mean = 0.0521692
- Std.dev = 0.0395672
- 85 items above graph maximum of 0.202762
|


