Data
507,960 items of data are available, covering 488,512 participants.
Defined-instances run from 0 to 1, labelled using Instancing
2.
Units of measurement are mmol/l.
| Maximum | 0.756106 |
| Decile 9 | 0.26095 |
| Decile 8 | 0.227506 |
| Decile 7 | 0.20478 |
| Decile 6 | 0.185937 |
| Median | 0.16889 |
| Decile 4 | 0.152557 |
| Decile 3 | 0.135662 |
| Decile 2 | 0.11699 |
| Decile 1 | 0.0929332 |
| Minimum | 0.000142815 |
|
|
- Mean = 0.173997
- Std.dev = 0.0662086
- 605 items above graph maximum of 0.428967
|
2 Instances
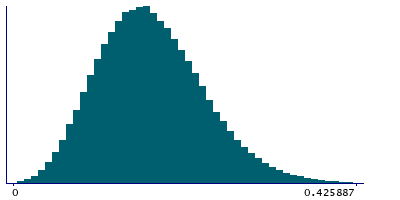
Instance 0 : Initial assessment visit (2006-2010) at which participants were recruited and consent given
488,083 participants, 488,083 items
| Maximum | 0.756106 |
| Decile 9 | 0.26105 |
| Decile 8 | 0.22756 |
| Decile 7 | 0.20486 |
| Decile 6 | 0.186014 |
| Median | 0.16899 |
| Decile 4 | 0.15267 |
| Decile 3 | 0.135808 |
| Decile 2 | 0.11716 |
| Decile 1 | 0.0931181 |
| Minimum | 0.000142815 |
|

|
- Mean = 0.174114
- Std.dev = 0.0661819
- 583 items above graph maximum of 0.428982
|
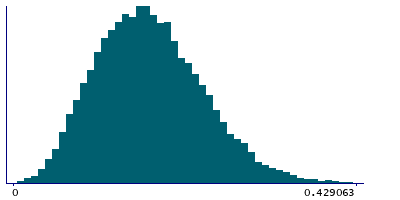
Instance 1 : First repeat assessment visit (2012-13)
19,877 participants, 19,877 items
| Maximum | 0.51666 |
| Decile 9 | 0.25892 |
| Decile 8 | 0.226395 |
| Decile 7 | 0.202947 |
| Decile 6 | 0.184021 |
| Median | 0.16623 |
| Decile 4 | 0.149615 |
| Decile 3 | 0.132416 |
| Decile 2 | 0.112775 |
| Decile 1 | 0.0882025 |
| Minimum | 0.005395 |
|
|
- Mean = 0.171116
- Std.dev = 0.066795
- 22 items above graph maximum of 0.429638
|


