Data
507,960 items of data are available, covering 488,512 participants.
Defined-instances run from 0 to 1, labelled using Instancing
2.
Units of measurement are mmol/l.
| Maximum | 0.63508 |
| Decile 9 | 0.228416 |
| Decile 8 | 0.20149 |
| Decile 7 | 0.183072 |
| Decile 6 | 0.16804 |
| Median | 0.154677 |
| Decile 4 | 0.1417 |
| Decile 3 | 0.1286 |
| Decile 2 | 0.114253 |
| Decile 1 | 0.096088 |
| Minimum | 0.00757458 |
|

|
- Mean = 0.159358
- Std.dev = 0.0524529
- 767 items above graph maximum of 0.360745
|
2 Instances
Instance 0 : Initial assessment visit (2006-2010) at which participants were recruited and consent given
488,083 participants, 488,083 items
| Maximum | 0.63508 |
| Decile 9 | 0.22861 |
| Decile 8 | 0.201686 |
| Decile 7 | 0.18324 |
| Decile 6 | 0.1682 |
| Median | 0.154835 |
| Decile 4 | 0.14184 |
| Decile 3 | 0.12875 |
| Decile 2 | 0.11437 |
| Decile 1 | 0.0961642 |
| Minimum | 0.00757458 |
|

|
- Mean = 0.159517
- Std.dev = 0.0525191
- 743 items above graph maximum of 0.361056
|
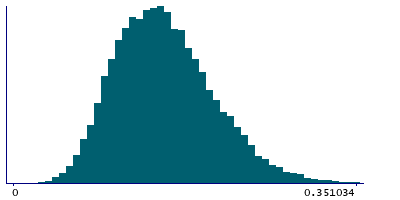
Instance 1 : First repeat assessment visit (2012-13)
19,877 participants, 19,877 items
| Maximum | 0.552875 |
| Decile 9 | 0.223191 |
| Decile 8 | 0.19628 |
| Decile 7 | 0.178454 |
| Decile 6 | 0.16382 |
| Median | 0.150885 |
| Decile 4 | 0.13835 |
| Decile 3 | 0.1253 |
| Decile 2 | 0.111603 |
| Decile 1 | 0.0944725 |
| Minimum | 0.021819 |
|
|
- Mean = 0.155454
- Std.dev = 0.0506427
- 24 items above graph maximum of 0.35191
|


