Data
507,960 items of data are available, covering 488,512 participants.
Defined-instances run from 0 to 1, labelled using Instancing
2.
Units of measurement are mmol/l.
| Maximum | 0.442052 |
| Decile 9 | 0.173521 |
| Decile 8 | 0.155831 |
| Decile 7 | 0.1436 |
| Decile 6 | 0.133676 |
| Median | 0.124675 |
| Decile 4 | 0.11589 |
| Decile 3 | 0.10683 |
| Decile 2 | 0.096582 |
| Decile 1 | 0.0830758 |
| Minimum | 0.00993161 |
|
|
- Mean = 0.127006
- Std.dev = 0.0356497
- 592 items above graph maximum of 0.263966
|
2 Instances
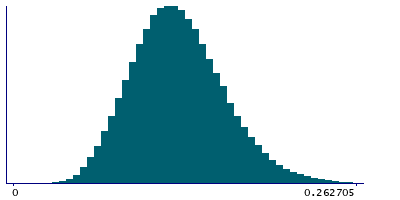
Instance 0 : Initial assessment visit (2006-2010) at which participants were recruited and consent given
488,083 participants, 488,083 items
| Maximum | 0.442052 |
| Decile 9 | 0.17352 |
| Decile 8 | 0.155816 |
| Decile 7 | 0.14359 |
| Decile 6 | 0.133685 |
| Median | 0.1247 |
| Decile 4 | 0.11595 |
| Decile 3 | 0.10691 |
| Decile 2 | 0.096698 |
| Decile 1 | 0.0832199 |
| Minimum | 0.00993161 |
|

|
- Mean = 0.127055
- Std.dev = 0.0356021
- 576 items above graph maximum of 0.26382
|
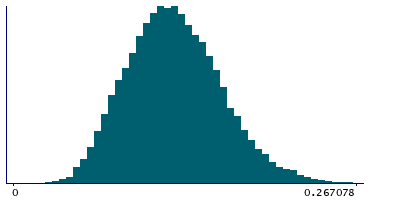
Instance 1 : First repeat assessment visit (2012-13)
19,877 participants, 19,877 items
| Maximum | 0.326621 |
| Decile 9 | 0.173659 |
| Decile 8 | 0.15632 |
| Decile 7 | 0.1439 |
| Decile 6 | 0.13331 |
| Median | 0.124 |
| Decile 4 | 0.11437 |
| Decile 3 | 0.104835 |
| Decile 2 | 0.093875 |
| Decile 1 | 0.079445 |
| Minimum | 0.019308 |
|
|
- Mean = 0.125807
- Std.dev = 0.0367791
- 16 items above graph maximum of 0.267873
|


