Data
507,960 items of data are available, covering 488,512 participants.
Defined-instances run from 0 to 1, labelled using Instancing
2.
Units of measurement are mmol/l.
| Maximum | 4.18447 |
| Decile 9 | 1.53342 |
| Decile 8 | 1.39009 |
| Decile 7 | 1.2935 |
| Decile 6 | 1.2134 |
| Median | 1.1406 |
| Decile 4 | 1.07021 |
| Decile 3 | 0.99659 |
| Decile 2 | 0.913707 |
| Decile 1 | 0.8017 |
| Minimum | 0 |
|

|
- Mean = 1.1573
- Std.dev = 0.291239
- 619 items above graph maximum of 2.26515
|
2 Instances
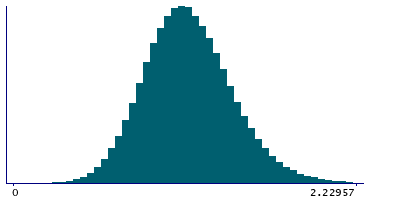
Instance 0 : Initial assessment visit (2006-2010) at which participants were recruited and consent given
488,083 participants, 488,083 items
| Maximum | 4.18447 |
| Decile 9 | 1.5341 |
| Decile 8 | 1.39074 |
| Decile 7 | 1.2942 |
| Decile 6 | 1.2141 |
| Median | 1.14131 |
| Decile 4 | 1.0709 |
| Decile 3 | 0.997412 |
| Decile 2 | 0.91472 |
| Decile 1 | 0.802893 |
| Minimum | 0 |
|
|
- Mean = 1.15808
- Std.dev = 0.291057
- 588 items above graph maximum of 2.26531
|
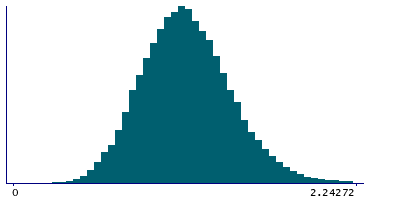
Instance 1 : First repeat assessment visit (2012-13)
19,877 participants, 19,877 items
| Maximum | 2.91651 |
| Decile 9 | 1.5151 |
| Decile 8 | 1.37352 |
| Decile 7 | 1.2777 |
| Decile 6 | 1.1956 |
| Median | 1.1224 |
| Decile 4 | 1.0524 |
| Decile 3 | 0.976778 |
| Decile 2 | 0.888375 |
| Decile 1 | 0.775326 |
| Minimum | 0.037896 |
|
|
- Mean = 1.13808
- Std.dev = 0.295029
- 31 items above graph maximum of 2.25487
|


