Data
507,960 items of data are available, covering 488,512 participants.
Defined-instances run from 0 to 1, labelled using Instancing
2.
Units of measurement are mmol/l.
| Maximum | 1.00211 |
| Decile 9 | 0.43132 |
| Decile 8 | 0.38628 |
| Decile 7 | 0.35548 |
| Decile 6 | 0.33017 |
| Median | 0.307612 |
| Decile 4 | 0.2855 |
| Decile 3 | 0.26274 |
| Decile 2 | 0.237266 |
| Decile 1 | 0.204052 |
| Minimum | 0 |
|
|
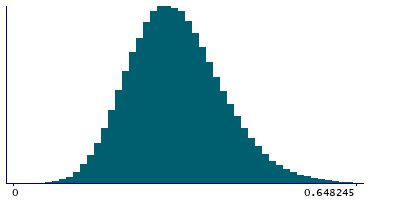
- Mean = 0.313786
- Std.dev = 0.0898413
- 495 items above graph maximum of 0.658588
|
2 Instances
Instance 0 : Initial assessment visit (2006-2010) at which participants were recruited and consent given
488,083 participants, 488,083 items
| Maximum | 1.00211 |
| Decile 9 | 0.431673 |
| Decile 8 | 0.38656 |
| Decile 7 | 0.35572 |
| Decile 6 | 0.330403 |
| Median | 0.307832 |
| Decile 4 | 0.2857 |
| Decile 3 | 0.262944 |
| Decile 2 | 0.237496 |
| Decile 1 | 0.204252 |
| Minimum | 0 |
|

|
- Mean = 0.314028
- Std.dev = 0.0899071
- 477 items above graph maximum of 0.659095
|
Instance 1 : First repeat assessment visit (2012-13)
19,877 participants, 19,877 items
| Maximum | 0.78651 |
| Decile 9 | 0.42189 |
| Decile 8 | 0.37977 |
| Decile 7 | 0.34922 |
| Decile 6 | 0.324415 |
| Median | 0.302185 |
| Decile 4 | 0.28058 |
| Decile 3 | 0.25716 |
| Decile 2 | 0.2323 |
| Decile 1 | 0.199738 |
| Minimum | 0.047646 |
|

|
- Mean = 0.307834
- Std.dev = 0.0880026
- 22 items above graph maximum of 0.644042
|


