Data
507,960 items of data are available, covering 488,512 participants.
Defined-instances run from 0 to 1, labelled using Instancing
2.
Units of measurement are mmol/l.
| Maximum | 0.870576 |
| Decile 9 | 0.37811 |
| Decile 8 | 0.344157 |
| Decile 7 | 0.32087 |
| Decile 6 | 0.30206 |
| Median | 0.285119 |
| Decile 4 | 0.26876 |
| Decile 3 | 0.251927 |
| Decile 2 | 0.233086 |
| Decile 1 | 0.20857 |
| Minimum | 0.024475 |
|

|
- Mean = 0.290132
- Std.dev = 0.0672576
- 578 items above graph maximum of 0.54765
|
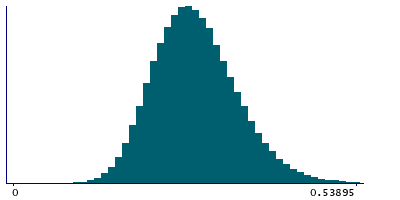
2 Instances
Instance 0 : Initial assessment visit (2006-2010) at which participants were recruited and consent given
488,083 participants, 488,083 items
| Maximum | 0.870576 |
| Decile 9 | 0.378433 |
| Decile 8 | 0.344394 |
| Decile 7 | 0.321082 |
| Decile 6 | 0.302264 |
| Median | 0.285278 |
| Decile 4 | 0.26894 |
| Decile 3 | 0.25207 |
| Decile 2 | 0.233247 |
| Decile 1 | 0.20872 |
| Minimum | 0.024475 |
|
|
- Mean = 0.290332
- Std.dev = 0.06732
- 552 items above graph maximum of 0.548146
|
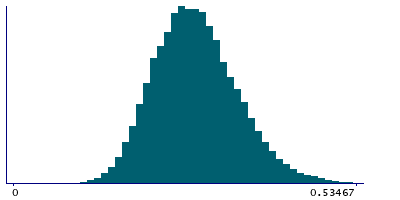
Instance 1 : First repeat assessment visit (2012-13)
19,877 participants, 19,877 items
| Maximum | 0.64696 |
| Decile 9 | 0.370595 |
| Decile 8 | 0.338335 |
| Decile 7 | 0.31571 |
| Decile 6 | 0.29756 |
| Median | 0.28106 |
| Decile 4 | 0.264735 |
| Decile 3 | 0.24824 |
| Decile 2 | 0.228755 |
| Decile 1 | 0.20509 |
| Minimum | 0.062534 |
|
|
- Mean = 0.285211
- Std.dev = 0.0655145
- 26 items above graph maximum of 0.5361
|


