Data
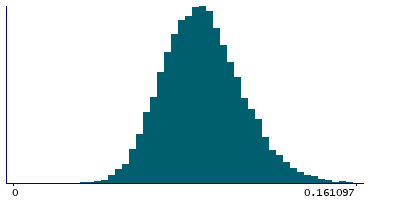
507,960 items of data are available, covering 488,512 participants.
Defined-instances run from 0 to 1, labelled using Instancing
2.
Units of measurement are mmol/l.
| Maximum | 0.267996 |
| Decile 9 | 0.11533 |
| Decile 8 | 0.10563 |
| Decile 7 | 0.09907 |
| Decile 6 | 0.0936882 |
| Median | 0.08887 |
| Decile 4 | 0.0842383 |
| Decile 3 | 0.0793853 |
| Decile 2 | 0.0739478 |
| Decile 1 | 0.066704 |
| Minimum | 1.5819e-07 |
|
|
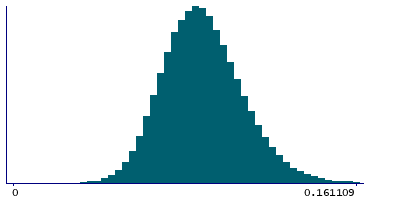
- Mean = 0.0901696
- Std.dev = 0.019377
- 600 items above graph maximum of 0.163956
|
2 Instances
Instance 0 : Initial assessment visit (2006-2010) at which participants were recruited and consent given
488,083 participants, 488,083 items
| Maximum | 0.267996 |
| Decile 9 | 0.115406 |
| Decile 8 | 0.10569 |
| Decile 7 | 0.0991232 |
| Decile 6 | 0.0937349 |
| Median | 0.088906 |
| Decile 4 | 0.0842732 |
| Decile 3 | 0.079418 |
| Decile 2 | 0.073989 |
| Decile 1 | 0.066743 |
| Minimum | 1.5819e-07 |
|
|
- Mean = 0.0902166
- Std.dev = 0.0193954
- 579 items above graph maximum of 0.164069
|
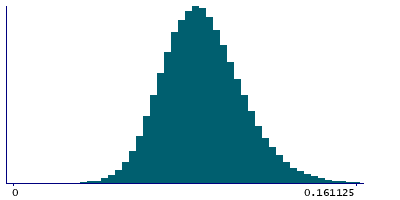
Instance 1 : First repeat assessment visit (2012-13)
19,877 participants, 19,877 items
| Maximum | 0.19611 |
| Decile 9 | 0.11368 |
| Decile 8 | 0.104247 |
| Decile 7 | 0.0978279 |
| Decile 6 | 0.092684 |
| Median | 0.0880094 |
| Decile 4 | 0.0833962 |
| Decile 3 | 0.078501 |
| Decile 2 | 0.073001 |
| Decile 1 | 0.0658568 |
| Minimum | 0.010104 |
|
|
- Mean = 0.0890145
- Std.dev = 0.0188814
- 22 items above graph maximum of 0.161503
|


