Data
507,960 items of data are available, covering 488,512 participants.
Defined-instances run from 0 to 1, labelled using Instancing
2.
Units of measurement are mmol/l.
| Maximum | 0.41297 |
| Decile 9 | 0.121493 |
| Decile 8 | 0.097085 |
| Decile 7 | 0.0810289 |
| Decile 6 | 0.068884 |
| Median | 0.059013 |
| Decile 4 | 0.050612 |
| Decile 3 | 0.043083 |
| Decile 2 | 0.0355943 |
| Decile 1 | 0.026867 |
| Minimum | 6.0775e-09 |
|

|
- Mean = 0.0677364
- Std.dev = 0.0387047
- 1477 items above graph maximum of 0.21612
|
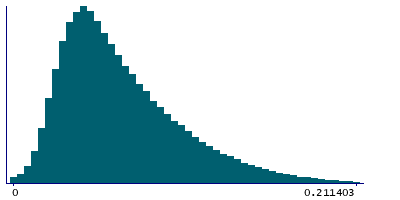
2 Instances
Instance 0 : Initial assessment visit (2006-2010) at which participants were recruited and consent given
488,083 participants, 488,083 items
| Maximum | 0.41297 |
| Decile 9 | 0.121086 |
| Decile 8 | 0.0967192 |
| Decile 7 | 0.0807068 |
| Decile 6 | 0.068581 |
| Median | 0.058784 |
| Decile 4 | 0.050423 |
| Decile 3 | 0.042933 |
| Decile 2 | 0.0354755 |
| Decile 1 | 0.0267753 |
| Minimum | 6.0775e-09 |
|
|
- Mean = 0.0674936
- Std.dev = 0.0385911
- 1430 items above graph maximum of 0.215397
|
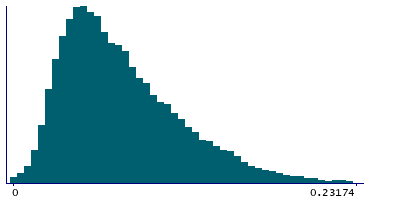
Instance 1 : First repeat assessment visit (2012-13)
19,877 participants, 19,877 items
| Maximum | 0.31022 |
| Decile 9 | 0.131385 |
| Decile 8 | 0.10575 |
| Decile 7 | 0.088973 |
| Decile 6 | 0.076035 |
| Median | 0.0652507 |
| Decile 4 | 0.055716 |
| Decile 3 | 0.0471725 |
| Decile 2 | 0.0388497 |
| Decile 1 | 0.029262 |
| Minimum | 2.1146e-07 |
|
|
- Mean = 0.0736975
- Std.dev = 0.0409465
- 39 items above graph maximum of 0.233508
|


