Data
507,960 items of data are available, covering 488,512 participants.
Defined-instances run from 0 to 1, labelled using Instancing
2.
Units of measurement are mmol/l.
| Maximum | 0.02473 |
| Decile 9 | 0.0116094 |
| Decile 8 | 0.010969 |
| Decile 7 | 0.010532 |
| Decile 6 | 0.010172 |
| Median | 0.00984264 |
| Decile 4 | 0.00952171 |
| Decile 3 | 0.00918414 |
| Decile 2 | 0.0087926 |
| Decile 1 | 0.0082554 |
| Minimum | 0.0015674 |
|

|
- Mean = 0.00990102
- Std.dev = 0.0013548
- 152 items below graph minimum of 0.00490135
- 860 items above graph maximum of 0.0149635
|
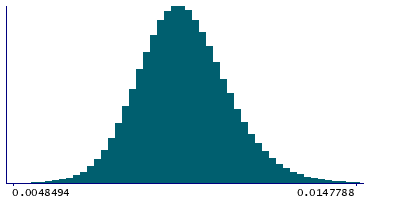
2 Instances
Instance 0 : Initial assessment visit (2006-2010) at which participants were recruited and consent given
488,083 participants, 488,083 items
| Maximum | 0.02473 |
| Decile 9 | 0.011613 |
| Decile 8 | 0.010972 |
| Decile 7 | 0.010535 |
| Decile 6 | 0.010175 |
| Median | 0.0098455 |
| Decile 4 | 0.0095243 |
| Decile 3 | 0.0091867 |
| Decile 2 | 0.0087952 |
| Decile 1 | 0.0082581 |
| Minimum | 0.0015674 |
|
|
- Mean = 0.00990359
- Std.dev = 0.00135416
- 145 items below graph minimum of 0.0049032
- 797 items above graph maximum of 0.0149679
|
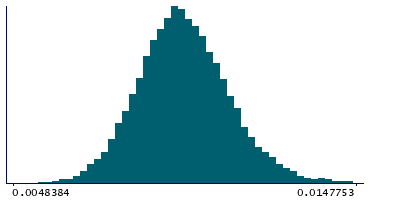
Instance 1 : First repeat assessment visit (2012-13)
19,877 participants, 19,877 items
| Maximum | 0.020078 |
| Decile 9 | 0.0115184 |
| Decile 8 | 0.010887 |
| Decile 7 | 0.0104575 |
| Decile 6 | 0.010097 |
| Median | 0.00976685 |
| Decile 4 | 0.0094552 |
| Decile 3 | 0.00911995 |
| Decile 2 | 0.00873522 |
| Decile 1 | 0.008188 |
| Minimum | 0.0035055 |
|
|
- Mean = 0.00983792
- Std.dev = 0.00136892
- 6 items below graph minimum of 0.00485762
- 67 items above graph maximum of 0.0148488
|


