Data
507,960 items of data are available, covering 488,512 participants.
Defined-instances run from 0 to 1, labelled using Instancing
2.
Units of measurement are mmol/l.
| Maximum | 1.15549 |
| Decile 9 | 0.534788 |
| Decile 8 | 0.50473 |
| Decile 7 | 0.48422 |
| Decile 6 | 0.467304 |
| Median | 0.45193 |
| Decile 4 | 0.436853 |
| Decile 3 | 0.42113 |
| Decile 2 | 0.402843 |
| Decile 1 | 0.37787 |
| Minimum | 0.00202396 |
|
|
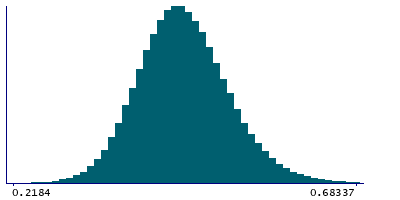
- Mean = 0.454763
- Std.dev = 0.0633762
- 160 items below graph minimum of 0.220952
- 880 items above graph maximum of 0.691705
|
2 Instances
Instance 0 : Initial assessment visit (2006-2010) at which participants were recruited and consent given
488,083 participants, 488,083 items
| Maximum | 1.15549 |
| Decile 9 | 0.534894 |
| Decile 8 | 0.50486 |
| Decile 7 | 0.48434 |
| Decile 6 | 0.46742 |
| Median | 0.452039 |
| Decile 4 | 0.43697 |
| Decile 3 | 0.421232 |
| Decile 2 | 0.402965 |
| Decile 1 | 0.377966 |
| Minimum | 0.00202396 |
|
|
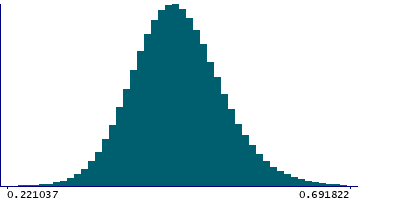
- Mean = 0.454862
- Std.dev = 0.0633432
- 153 items below graph minimum of 0.221037
- 817 items above graph maximum of 0.691822
|
Instance 1 : First repeat assessment visit (2012-13)
19,877 participants, 19,877 items
| Maximum | 0.94239 |
| Decile 9 | 0.53181 |
| Decile 8 | 0.501985 |
| Decile 7 | 0.480895 |
| Decile 6 | 0.464405 |
| Median | 0.44915 |
| Decile 4 | 0.434085 |
| Decile 3 | 0.418649 |
| Decile 2 | 0.400145 |
| Decile 1 | 0.375705 |
| Minimum | 0.15099 |
|
|
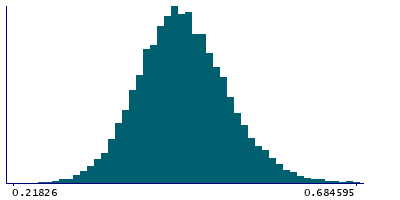
- Mean = 0.45234
- Std.dev = 0.0641338
- 7 items below graph minimum of 0.2196
- 66 items above graph maximum of 0.687915
|


