Data
503,466 items of data are available, covering 484,319 participants.
Defined-instances run from 0 to 1, labelled using Instancing
2.
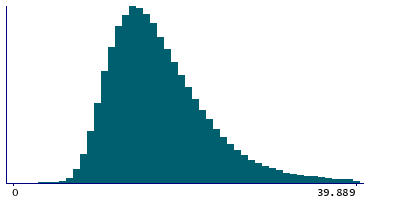
Units of measurement are percent.
| Maximum | 98.376 |
| Decile 9 | 25.5325 |
| Decile 8 | 21.6619 |
| Decile 7 | 19.338 |
| Decile 6 | 17.592 |
| Median | 16.129 |
| Decile 4 | 14.825 |
| Decile 3 | 13.586 |
| Decile 2 | 12.289 |
| Decile 1 | 10.745 |
| Minimum | 0.0154877 |
|
|
- Mean = 17.5467
- Std.dev = 7.04673
- 7010 items above graph maximum of 40.3201
|
2 Instances
Instance 0 : Initial assessment visit (2006-2010) at which participants were recruited and consent given
483,759 participants, 483,759 items
| Maximum | 98.376 |
| Decile 9 | 25.5582 |
| Decile 8 | 21.6815 |
| Decile 7 | 19.353 |
| Decile 6 | 17.602 |
| Median | 16.139 |
| Decile 4 | 14.834 |
| Decile 3 | 13.593 |
| Decile 2 | 12.297 |
| Decile 1 | 10.753 |
| Minimum | 0.0154877 |
|

|
- Mean = 17.5617
- Std.dev = 7.0596
- 6752 items above graph maximum of 40.3634
|
Instance 1 : First repeat assessment visit (2012-13)
19,707 participants, 19,707 items
| Maximum | 86.578 |
| Decile 9 | 24.8228 |
| Decile 8 | 21.175 |
| Decile 7 | 18.9664 |
| Decile 6 | 17.337 |
| Median | 15.8707 |
| Decile 4 | 14.6011 |
| Decile 3 | 13.3768 |
| Decile 2 | 12.1035 |
| Decile 1 | 10.567 |
| Minimum | 1.1599 |
|

|
- Mean = 17.1792
- Std.dev = 6.71288
- 270 items above graph maximum of 39.0785
|


