Data
507,960 items of data are available, covering 488,512 participants.
Defined-instances run from 0 to 1, labelled using Instancing
2.
Units of measurement are percent.
| Maximum | 58.862 |
| Decile 9 | 24.436 |
| Decile 8 | 23.758 |
| Decile 7 | 23.2461 |
| Decile 6 | 22.788 |
| Median | 22.346 |
| Decile 4 | 21.8911 |
| Decile 3 | 21.387 |
| Decile 2 | 20.77 |
| Decile 1 | 19.844 |
| Minimum | 4.812e-05 |
|
|
- Mean = 22.2171
- Std.dev = 1.84623
- 949 items below graph minimum of 15.252
- 88 items above graph maximum of 29.028
|
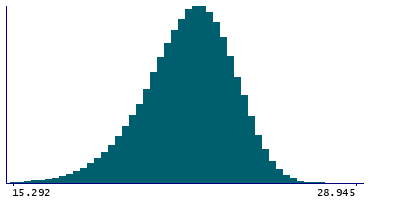
2 Instances
Instance 0 : Initial assessment visit (2006-2010) at which participants were recruited and consent given
488,083 participants, 488,083 items
| Maximum | 58.862 |
| Decile 9 | 24.4352 |
| Decile 8 | 23.7579 |
| Decile 7 | 23.2469 |
| Decile 6 | 22.789 |
| Median | 22.348 |
| Decile 4 | 21.8948 |
| Decile 3 | 21.391 |
| Decile 2 | 20.776 |
| Decile 1 | 19.8533 |
| Minimum | 4.812e-05 |
|

|
- Mean = 22.22
- Std.dev = 1.84353
- 913 items below graph minimum of 15.2714
- 89 items above graph maximum of 29.0171
|
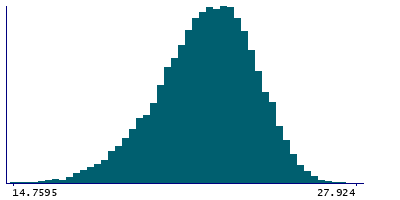
Instance 1 : First repeat assessment visit (2012-13)
19,877 participants, 19,877 items
| Maximum | 28.7778 |
| Decile 9 | 24.4538 |
| Decile 8 | 23.762 |
| Decile 7 | 23.234 |
| Decile 6 | 22.769 |
| Median | 22.2945 |
| Decile 4 | 21.807 |
| Decile 3 | 21.284 |
| Decile 2 | 20.6294 |
| Decile 1 | 19.626 |
| Minimum | 9.8477 |
|
|
- Mean = 22.1445
- Std.dev = 1.90993
- 44 items below graph minimum of 14.7982
|


