Data
507,960 items of data are available, covering 488,512 participants.
Defined-instances run from 0 to 1, labelled using Instancing
2.
Units of measurement are percent.
| Maximum | 48.031 |
| Decile 9 | 40.7003 |
| Decile 8 | 40.016 |
| Decile 7 | 39.5 |
| Decile 6 | 39.0344 |
| Median | 38.5832 |
| Decile 4 | 38.112 |
| Decile 3 | 37.582 |
| Decile 2 | 36.924 |
| Decile 1 | 35.9447 |
| Minimum | 0.938303 |
|
|
- Mean = 38.4218
- Std.dev = 1.90935
- 947 items below graph minimum of 31.1891
- 6 items above graph maximum of 45.4559
|
2 Instances
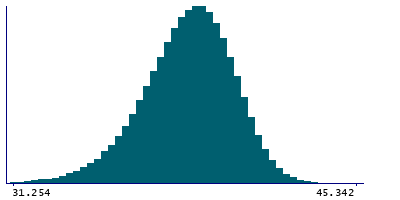
Instance 0 : Initial assessment visit (2006-2010) at which participants were recruited and consent given
488,083 participants, 488,083 items
| Maximum | 48.031 |
| Decile 9 | 40.7072 |
| Decile 8 | 40.021 |
| Decile 7 | 39.5046 |
| Decile 6 | 39.038 |
| Median | 38.5859 |
| Decile 4 | 38.114 |
| Decile 3 | 37.583 |
| Decile 2 | 36.923 |
| Decile 1 | 35.942 |
| Minimum | 0.938303 |
|

|
- Mean = 38.4236
- Std.dev = 1.91411
- 922 items below graph minimum of 31.1768
- 6 items above graph maximum of 45.4723
|
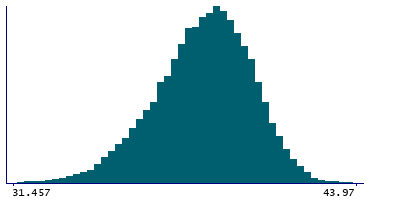
Instance 1 : First repeat assessment visit (2012-13)
19,877 participants, 19,877 items
| Maximum | 44.6633 |
| Decile 9 | 40.523 |
| Decile 8 | 39.889 |
| Decile 7 | 39.395 |
| Decile 6 | 38.956 |
| Median | 38.528 |
| Decile 4 | 38.061 |
| Decile 3 | 37.5716 |
| Decile 2 | 36.9421 |
| Decile 1 | 35.9987 |
| Minimum | 27.806 |
|
|
- Mean = 38.3774
- Std.dev = 1.78791
- 23 items below graph minimum of 31.4744
|


