Data
507,960 items of data are available, covering 488,512 participants.
Defined-instances run from 0 to 1, labelled using Instancing
2.
Units of measurement are percent.
| Maximum | 39.825 |
| Decile 9 | 30.6915 |
| Decile 8 | 30.042 |
| Decile 7 | 29.5468 |
| Decile 6 | 29.103 |
| Median | 28.667 |
| Decile 4 | 28.203 |
| Decile 3 | 27.68 |
| Decile 2 | 27.023 |
| Decile 1 | 26.015 |
| Minimum | 6.0628e-05 |
|

|
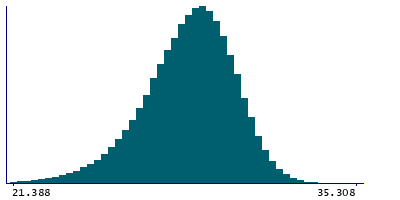
- Mean = 28.4722
- Std.dev = 1.90485
- 1383 items below graph minimum of 21.3385
- 3 items above graph maximum of 35.368
|
2 Instances
Instance 0 : Initial assessment visit (2006-2010) at which participants were recruited and consent given
488,083 participants, 488,083 items
| Maximum | 39.825 |
| Decile 9 | 30.7 |
| Decile 8 | 30.048 |
| Decile 7 | 29.552 |
| Decile 6 | 29.108 |
| Median | 28.6708 |
| Decile 4 | 28.206 |
| Decile 3 | 27.681 |
| Decile 2 | 27.023 |
| Decile 1 | 26.013 |
| Minimum | 6.0628e-05 |
|
|
- Mean = 28.4749
- Std.dev = 1.90989
- 1338 items below graph minimum of 21.326
- 3 items above graph maximum of 35.387
|
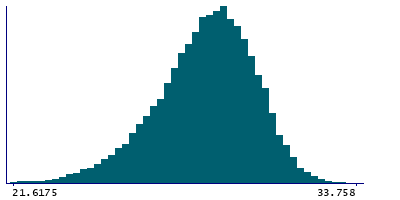
Instance 1 : First repeat assessment visit (2012-13)
19,877 participants, 19,877 items
| Maximum | 33.9782 |
| Decile 9 | 30.506 |
| Decile 8 | 29.895 |
| Decile 7 | 29.425 |
| Decile 6 | 28.994 |
| Median | 28.582 |
| Decile 4 | 28.1448 |
| Decile 3 | 27.646 |
| Decile 2 | 27.01 |
| Decile 1 | 26.0535 |
| Minimum | 15.631 |
|
|
- Mean = 28.4039
- Std.dev = 1.77534
- 34 items below graph minimum of 21.601
|


