Data
77,958 items of data are available, covering 73,705 participants.
Defined-instances run from 2 to 3, labelled using Instancing
2.
| Maximum | 32.9972 |
| Decile 9 | -1.64995 |
| Decile 8 | -5.39265 |
| Decile 7 | -7.90492 |
| Decile 6 | -10.0337 |
| Median | -11.9869 |
| Decile 4 | -13.9192 |
| Decile 3 | -15.8901 |
| Decile 2 | -18.2151 |
| Decile 1 | -21.383 |
| Minimum | -106.13 |
|

|
- Mean = -11.7134
- Std.dev = 7.84594
- 12 items below graph minimum of -41.116
- 51 items above graph maximum of 18.0831
|
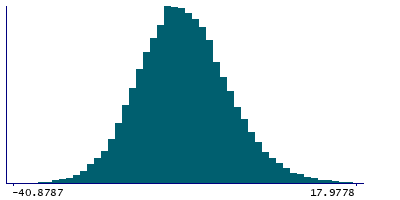
2 Instances
Instance 2 : Imaging visit (2014+)
73,327 participants, 73,327 items
| Maximum | 32.9972 |
| Decile 9 | -1.63981 |
| Decile 8 | -5.38256 |
| Decile 7 | -7.89824 |
| Decile 6 | -10.0282 |
| Median | -11.9791 |
| Decile 4 | -13.9072 |
| Decile 3 | -15.8794 |
| Decile 2 | -18.1966 |
| Decile 1 | -21.359 |
| Minimum | -106.13 |
|
|
- Mean = -11.7028
- Std.dev = 7.84559
- 12 items below graph minimum of -41.0783
- 47 items above graph maximum of 18.0794
|
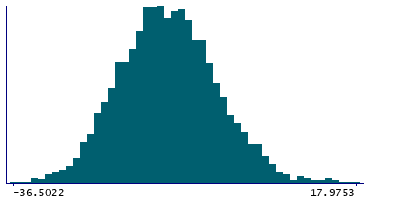
Instance 3 : First repeat imaging visit (2019+)
4,631 participants, 4,631 items
| Maximum | 25.971 |
| Decile 9 | -1.91883 |
| Decile 8 | -5.55334 |
| Decile 7 | -8.04895 |
| Decile 6 | -10.099 |
| Median | -12.1328 |
| Decile 4 | -14.0932 |
| Decile 3 | -16.0711 |
| Decile 2 | -18.5521 |
| Decile 1 | -21.7193 |
| Minimum | -36.5022 |
|
|
- Mean = -11.881
- Std.dev = 7.8496
- 5 items above graph maximum of 17.8817
|
Notes
Median magnetic susceptibility in right thalamus (from QSM processing of SWI data)
0 Related Data-Fields
There are no related data-fields


