Data
77,958 items of data are available, covering 73,705 participants.
Defined-instances run from 2 to 3, labelled using Instancing
2.
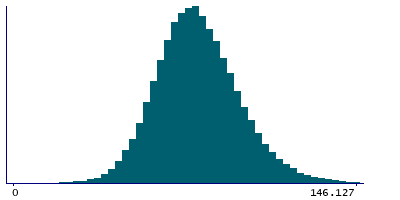
| Maximum | 417.656 |
| Decile 9 | 102.983 |
| Decile 8 | 93.9305 |
| Decile 7 | 87.7746 |
| Decile 6 | 82.8965 |
| Median | 78.4324 |
| Decile 4 | 74.1764 |
| Decile 3 | 69.6626 |
| Decile 2 | 64.5772 |
| Decile 1 | 57.6307 |
| Minimum | -92.4973 |
|
|
- Mean = 79.5978
- Std.dev = 18.6736
- 33 items below graph minimum of 0
- 179 items above graph maximum of 148.335
|
2 Instances
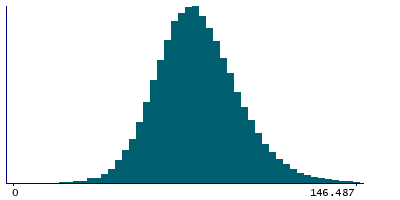
Instance 2 : Imaging visit (2014+)
73,327 participants, 73,327 items
| Maximum | 417.656 |
| Decile 9 | 103.22 |
| Decile 8 | 94.1269 |
| Decile 7 | 87.9831 |
| Decile 6 | 83.0679 |
| Median | 78.6056 |
| Decile 4 | 74.3335 |
| Decile 3 | 69.8228 |
| Decile 2 | 64.7063 |
| Decile 1 | 57.7486 |
| Minimum | -92.4973 |
|
|
- Mean = 79.7693
- Std.dev = 18.7378
- 33 items below graph minimum of 0
- 166 items above graph maximum of 148.692
|
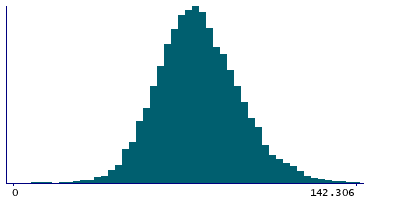
Instance 3 : First repeat imaging visit (2019+)
4,631 participants, 4,631 items
| Maximum | 179.588 |
| Decile 9 | 99.0949 |
| Decile 8 | 90.7252 |
| Decile 7 | 84.9691 |
| Decile 6 | 80.1651 |
| Median | 75.9851 |
| Decile 4 | 71.849 |
| Decile 3 | 67.5988 |
| Decile 2 | 62.7805 |
| Decile 1 | 55.8839 |
| Minimum | 8.72427 |
|
|
- Mean = 76.8832
- Std.dev = 17.4024
- 7 items above graph maximum of 142.306
|
Notes
Median magnetic susceptibility in left pallidum (from QSM processing of SWI data)
0 Related Data-Fields
There are no related data-fields


