Data
83,911 items of data are available, covering 79,384 participants.
Defined-instances run from 2 to 3, labelled using Instancing
2.
Units of measurement are AU.
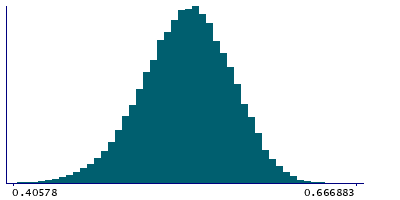
| Maximum | 0.785728 |
| Decile 9 | 0.579226 |
| Decile 8 | 0.565473 |
| Decile 7 | 0.554932 |
| Decile 6 | 0.545984 |
| Median | 0.537571 |
| Decile 4 | 0.528965 |
| Decile 3 | 0.519316 |
| Decile 2 | 0.507996 |
| Decile 1 | 0.491829 |
| Minimum | 0 |
|
|
- Mean = 0.536172
- Std.dev = 0.0346161
- 85 items below graph minimum of 0.404431
- 1 item above graph maximum of 0.666624
|
2 Instances
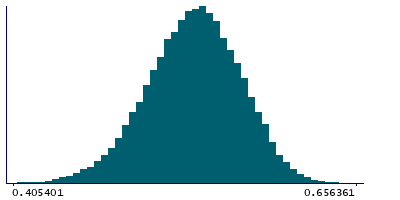
Instance 2 : Imaging visit (2014+)
79,153 participants, 79,153 items
| Maximum | 0.656361 |
| Decile 9 | 0.579185 |
| Decile 8 | 0.565433 |
| Decile 7 | 0.554848 |
| Decile 6 | 0.54587 |
| Median | 0.537459 |
| Decile 4 | 0.528809 |
| Decile 3 | 0.519148 |
| Decile 2 | 0.507831 |
| Decile 1 | 0.491649 |
| Minimum | 0 |
|
|
- Mean = 0.536045
- Std.dev = 0.0346557
- 79 items below graph minimum of 0.404113
|
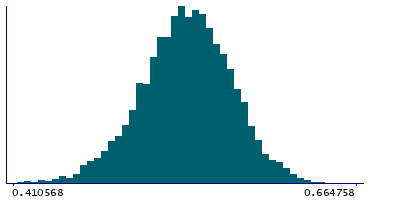
Instance 3 : First repeat imaging visit (2019+)
4,758 participants, 4,758 items
| Maximum | 0.785728 |
| Decile 9 | 0.580021 |
| Decile 8 | 0.566394 |
| Decile 7 | 0.556219 |
| Decile 6 | 0.54767 |
| Median | 0.539245 |
| Decile 4 | 0.531142 |
| Decile 3 | 0.522118 |
| Decile 2 | 0.511426 |
| Decile 1 | 0.495264 |
| Minimum | 0.343062 |
|
|
- Mean = 0.538278
- Std.dev = 0.0338807
- 7 items below graph minimum of 0.410507
- 1 item above graph maximum of 0.664779
|
Notes
Mean FA (fractional anisotropy) in corticospinal tract (left) on FA skeleton (from dMRI data)
0 Related Data-Fields
There are no related data-fields
2 Applications
| Application ID | Title |
|---|
| 17689 | Genetic, environmental and lifestyle predictors of brain/cognitive-related outcomes. |
| 22783 | The joint analysis of imaging data and genetic data for early tumor detection, prevention, diagnosis and treatment |

