Data
83,911 items of data are available, covering 79,384 participants.
Defined-instances run from 2 to 3, labelled using Instancing
2.
Units of measurement are AU.
| Maximum | 0.80299 |
| Decile 9 | 0.709525 |
| Decile 8 | 0.699687 |
| Decile 7 | 0.692348 |
| Decile 6 | 0.68606 |
| Median | 0.680154 |
| Decile 4 | 0.67399 |
| Decile 3 | 0.667385 |
| Decile 2 | 0.6594 |
| Decile 1 | 0.647958 |
| Minimum | 0 |
|

|
- Mean = 0.679232
- Std.dev = 0.0245343
- 73 items below graph minimum of 0.586392
- 8 items above graph maximum of 0.771091
|
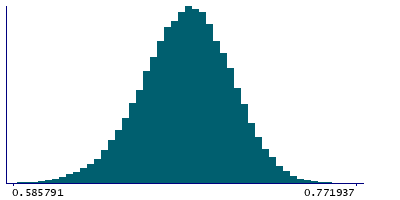
2 Instances
Instance 2 : Imaging visit (2014+)
79,153 participants, 79,153 items
| Maximum | 0.80299 |
| Decile 9 | 0.709569 |
| Decile 8 | 0.699752 |
| Decile 7 | 0.692389 |
| Decile 6 | 0.686114 |
| Median | 0.680171 |
| Decile 4 | 0.673971 |
| Decile 3 | 0.667324 |
| Decile 2 | 0.659346 |
| Decile 1 | 0.647915 |
| Minimum | 0 |
|
|
- Mean = 0.679234
- Std.dev = 0.024582
- 69 items below graph minimum of 0.586261
- 7 items above graph maximum of 0.771223
|
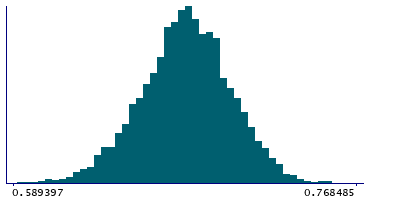
Instance 3 : First repeat imaging visit (2019+)
4,758 participants, 4,758 items
| Maximum | 0.784915 |
| Decile 9 | 0.708797 |
| Decile 8 | 0.698407 |
| Decile 7 | 0.691722 |
| Decile 6 | 0.685356 |
| Median | 0.679897 |
| Decile 4 | 0.674284 |
| Decile 3 | 0.668315 |
| Decile 2 | 0.660192 |
| Decile 1 | 0.649055 |
| Minimum | 0.460702 |
|
|
- Mean = 0.679196
- Std.dev = 0.0237269
- 4 items below graph minimum of 0.589312
- 1 item above graph maximum of 0.76854
|
Notes
Mean FA (fractional anisotropy) in posterior limb of internal capsule (right) on FA skeleton (from dMRI data)
0 Related Data-Fields
There are no related data-fields
2 Applications
| Application ID | Title |
|---|
| 17689 | Genetic, environmental and lifestyle predictors of brain/cognitive-related outcomes. |
| 22783 | The joint analysis of imaging data and genetic data for early tumor detection, prevention, diagnosis and treatment |

