Data
83,911 items of data are available, covering 79,384 participants.
Defined-instances run from 2 to 3, labelled using Instancing
2.
Units of measurement are AU.
| Maximum | 0.714177 |
| Decile 9 | 0.627658 |
| Decile 8 | 0.61607 |
| Decile 7 | 0.607704 |
| Decile 6 | 0.600426 |
| Median | 0.593638 |
| Decile 4 | 0.586514 |
| Decile 3 | 0.578928 |
| Decile 2 | 0.569751 |
| Decile 1 | 0.556315 |
| Minimum | 0 |
|
|
- Mean = 0.592492
- Std.dev = 0.0284483
- 99 items below graph minimum of 0.484971
- 3 items above graph maximum of 0.699002
|
2 Instances
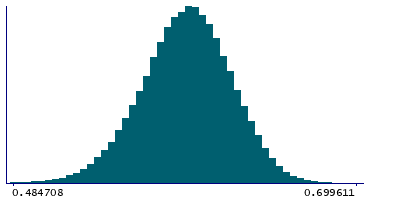
Instance 2 : Imaging visit (2014+)
79,153 participants, 79,153 items
| Maximum | 0.714177 |
| Decile 9 | 0.627676 |
| Decile 8 | 0.616097 |
| Decile 7 | 0.607746 |
| Decile 6 | 0.600485 |
| Median | 0.593686 |
| Decile 4 | 0.586559 |
| Decile 3 | 0.578939 |
| Decile 2 | 0.569749 |
| Decile 1 | 0.556273 |
| Minimum | 0 |
|

|
- Mean = 0.592515
- Std.dev = 0.0285061
- 95 items below graph minimum of 0.484871
- 3 items above graph maximum of 0.699079
|
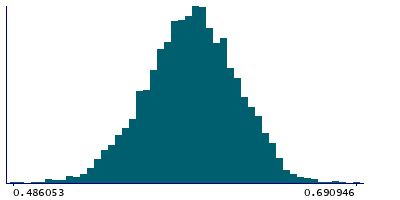
Instance 3 : First repeat imaging visit (2019+)
4,758 participants, 4,758 items
| Maximum | 0.690946 |
| Decile 9 | 0.627418 |
| Decile 8 | 0.615153 |
| Decile 7 | 0.60717 |
| Decile 6 | 0.599347 |
| Median | 0.592993 |
| Decile 4 | 0.585885 |
| Decile 3 | 0.57878 |
| Decile 2 | 0.569827 |
| Decile 1 | 0.556706 |
| Minimum | 0.452345 |
|
|
- Mean = 0.592099
- Std.dev = 0.0274665
- 5 items below graph minimum of 0.485993
|
Notes
Mean FA (fractional anisotropy) in retrolenticular part of internal capsule (right) on FA skeleton (from dMRI data)
0 Related Data-Fields
There are no related data-fields
2 Applications
| Application ID | Title |
|---|
| 17689 | Genetic, environmental and lifestyle predictors of brain/cognitive-related outcomes. |
| 22783 | The joint analysis of imaging data and genetic data for early tumor detection, prevention, diagnosis and treatment |

