Data
83,911 items of data are available, covering 79,384 participants.
Defined-instances run from 2 to 3, labelled using Instancing
2.
Units of measurement are AU.
| Maximum | 0.742893 |
| Decile 9 | 0.562426 |
| Decile 8 | 0.551659 |
| Decile 7 | 0.54371 |
| Decile 6 | 0.536769 |
| Median | 0.530174 |
| Decile 4 | 0.523394 |
| Decile 3 | 0.515952 |
| Decile 2 | 0.507034 |
| Decile 1 | 0.493635 |
| Minimum | 0.194722 |
|

|
- Mean = 0.528673
- Std.dev = 0.0280206
- 250 items below graph minimum of 0.424844
- 3 items above graph maximum of 0.631217
|
2 Instances
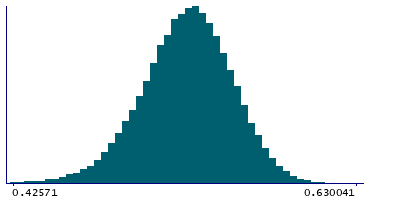
Instance 2 : Imaging visit (2014+)
79,153 participants, 79,153 items
| Maximum | 0.661174 |
| Decile 9 | 0.562395 |
| Decile 8 | 0.551627 |
| Decile 7 | 0.543672 |
| Decile 6 | 0.536697 |
| Median | 0.530085 |
| Decile 4 | 0.523262 |
| Decile 3 | 0.515796 |
| Decile 2 | 0.506895 |
| Decile 1 | 0.493486 |
| Minimum | 0.194722 |
|
|
- Mean = 0.528567
- Std.dev = 0.02809
- 239 items below graph minimum of 0.424577
- 2 items above graph maximum of 0.631304
|
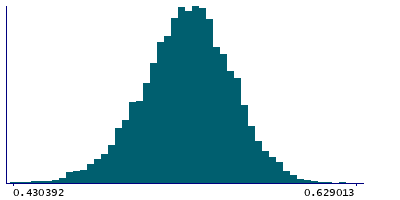
Instance 3 : First repeat imaging visit (2019+)
4,758 participants, 4,758 items
| Maximum | 0.742893 |
| Decile 9 | 0.562825 |
| Decile 8 | 0.552505 |
| Decile 7 | 0.544358 |
| Decile 6 | 0.537917 |
| Median | 0.531438 |
| Decile 4 | 0.525155 |
| Decile 3 | 0.517846 |
| Decile 2 | 0.509517 |
| Decile 1 | 0.496587 |
| Minimum | 0.396865 |
|
|
- Mean = 0.530437
- Std.dev = 0.0267781
- 13 items below graph minimum of 0.430349
- 1 item above graph maximum of 0.629062
|
Notes
Mean FA (fractional anisotropy) in superior longitudinal fasciculus (left) on FA skeleton (from dMRI data)
0 Related Data-Fields
There are no related data-fields
2 Applications
| Application ID | Title |
|---|
| 17689 | Genetic, environmental and lifestyle predictors of brain/cognitive-related outcomes. |
| 22783 | The joint analysis of imaging data and genetic data for early tumor detection, prevention, diagnosis and treatment |

