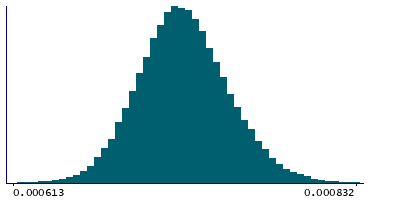
Data
83,911 items of data are available, covering 79,384 participants.
Defined-instances run from 2 to 3, labelled using Instancing
2.
Units of measurement are AU.
| Maximum | 0.001389 |
| Decile 9 | 0.000757 |
| Decile 8 | 0.000743 |
| Decile 7 | 0.000734 |
| Decile 6 | 0.000726 |
| Median | 0.000719 |
| Decile 4 | 0.000712 |
| Decile 3 | 0.000705 |
| Decile 2 | 0.000696 |
| Decile 1 | 0.000685 |
| Minimum | 0 |
|
|
- Mean = 0.000720206
- Std.dev = 3.00759e-05
- 53 items below graph minimum of 0.000613
- 96 items above graph maximum of 0.000829
|
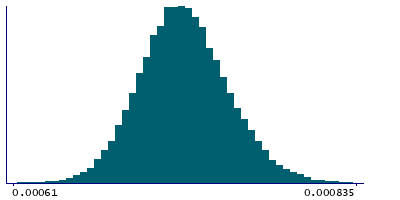
2 Instances
Instance 2 : Imaging visit (2014+)
79,153 participants, 79,153 items
| Maximum | 0.001389 |
| Decile 9 | 0.000758 |
| Decile 8 | 0.000744 |
| Decile 7 | 0.000734 |
| Decile 6 | 0.000726 |
| Median | 0.000719 |
| Decile 4 | 0.000712 |
| Decile 3 | 0.000705 |
| Decile 2 | 0.000696 |
| Decile 1 | 0.000685 |
| Minimum | 0 |
|
|
- Mean = 0.000720267
- Std.dev = 3.02564e-05
- 44 items below graph minimum of 0.000612
- 93 items above graph maximum of 0.000831
|
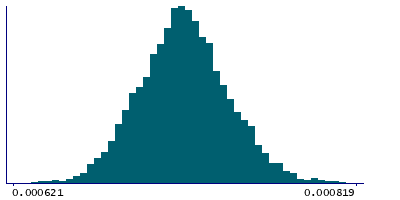
Instance 3 : First repeat imaging visit (2019+)
4,758 participants, 4,758 items
| Maximum | 0.000829 |
| Decile 9 | 0.000753 |
| Decile 8 | 0.00074 |
| Decile 7 | 0.000732 |
| Decile 6 | 0.000725 |
| Median | 0.000719 |
| Decile 4 | 0.000713 |
| Decile 3 | 0.000706 |
| Decile 2 | 0.000698 |
| Decile 1 | 0.000687 |
| Minimum | 0.000336 |
|
|
- Mean = 0.000719196
- Std.dev = 2.68759e-05
- 5 items below graph minimum of 0.000621
- 3 items above graph maximum of 0.000819
|
Notes
Mean MD (mean diffusivity) in cerebral peduncle (right) on FA (fractional anisotropy) skeleton (from dMRI data)
0 Related Data-Fields
There are no related data-fields
2 Applications
| Application ID | Title |
|---|
| 17689 | Genetic, environmental and lifestyle predictors of brain/cognitive-related outcomes. |
| 22783 | The joint analysis of imaging data and genetic data for early tumor detection, prevention, diagnosis and treatment |

