Data
83,911 items of data are available, covering 79,384 participants.
Defined-instances run from 2 to 3, labelled using Instancing
2.
Units of measurement are AU.
| Maximum | 0.001422 |
| Decile 9 | 0.000748 |
| Decile 8 | 0.000735 |
| Decile 7 | 0.000726 |
| Decile 6 | 0.000719 |
| Median | 0.000712 |
| Decile 4 | 0.000705 |
| Decile 3 | 0.000698 |
| Decile 2 | 0.00069 |
| Decile 1 | 0.000678 |
| Minimum | 0 |
|

|
- Mean = 0.000712615
- Std.dev = 2.9699e-05
- 62 items below graph minimum of 0.000608
- 114 items above graph maximum of 0.000818
|
2 Instances
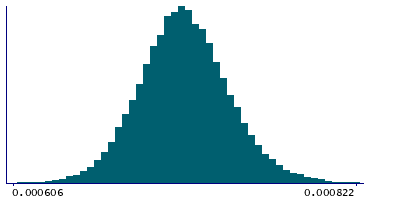
Instance 2 : Imaging visit (2014+)
79,153 participants, 79,153 items
| Maximum | 0.001422 |
| Decile 9 | 0.000749 |
| Decile 8 | 0.000735 |
| Decile 7 | 0.000726 |
| Decile 6 | 0.000719 |
| Median | 0.000712 |
| Decile 4 | 0.000705 |
| Decile 3 | 0.000698 |
| Decile 2 | 0.00069 |
| Decile 1 | 0.000678 |
| Minimum | 0 |
|
|
- Mean = 0.000712832
- Std.dev = 2.98398e-05
- 55 items below graph minimum of 0.000607
- 100 items above graph maximum of 0.00082
|
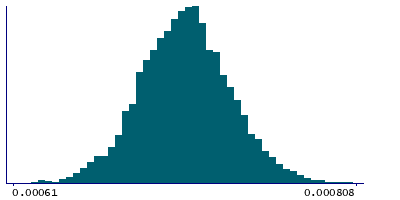
Instance 3 : First repeat imaging visit (2019+)
4,758 participants, 4,758 items
| Maximum | 0.000876 |
| Decile 9 | 0.000742 |
| Decile 8 | 0.00073 |
| Decile 7 | 0.000722 |
| Decile 6 | 0.000715 |
| Median | 0.000709 |
| Decile 4 | 0.000703 |
| Decile 3 | 0.000695 |
| Decile 2 | 0.000687 |
| Decile 1 | 0.000676 |
| Minimum | 0.000429 |
|
|
- Mean = 0.000709
- Std.dev = 2.69944e-05
- 4 items below graph minimum of 0.00061
- 5 items above graph maximum of 0.000808
|
Notes
Mean MD (mean diffusivity) in cerebral peduncle (left) on FA (fractional anisotropy) skeleton (from dMRI data)
0 Related Data-Fields
There are no related data-fields
2 Applications
| Application ID | Title |
|---|
| 17689 | Genetic, environmental and lifestyle predictors of brain/cognitive-related outcomes. |
| 22783 | The joint analysis of imaging data and genetic data for early tumor detection, prevention, diagnosis and treatment |

