Data
83,911 items of data are available, covering 79,384 participants.
Defined-instances run from 2 to 3, labelled using Instancing
2.
Units of measurement are AU.
| Maximum | 0.002111 |
| Decile 9 | 0.00091 |
| Decile 8 | 0.000882 |
| Decile 7 | 0.000865 |
| Decile 6 | 0.000851 |
| Median | 0.00084 |
| Decile 4 | 0.00083 |
| Decile 3 | 0.000819 |
| Decile 2 | 0.000807 |
| Decile 1 | 0.000791 |
| Minimum | 0 |
|
|
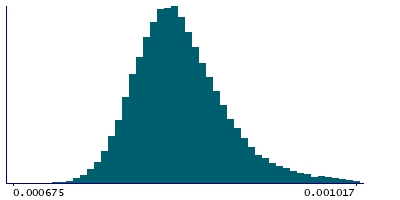
- Mean = 0.000847112
- Std.dev = 5.25371e-05
- 6 items below graph minimum of 0.000672
- 623 items above graph maximum of 0.001029
|
2 Instances
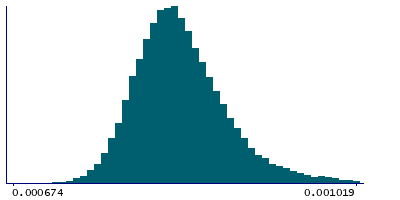
Instance 2 : Imaging visit (2014+)
79,153 participants, 79,153 items
| Maximum | 0.002111 |
| Decile 9 | 0.000911 |
| Decile 8 | 0.000883 |
| Decile 7 | 0.000866 |
| Decile 6 | 0.000852 |
| Median | 0.000841 |
| Decile 4 | 0.00083 |
| Decile 3 | 0.00082 |
| Decile 2 | 0.000808 |
| Decile 1 | 0.000792 |
| Minimum | 0 |
|
|
- Mean = 0.000848055
- Std.dev = 5.27592e-05
- 6 items below graph minimum of 0.000673
- 596 items above graph maximum of 0.00103
|
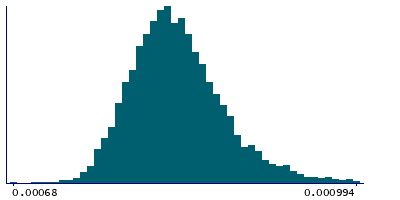
Instance 3 : First repeat imaging visit (2019+)
4,758 participants, 4,758 items
| Maximum | 0.001161 |
| Decile 9 | 0.000887 |
| Decile 8 | 0.000863 |
| Decile 7 | 0.000848 |
| Decile 6 | 0.000836 |
| Median | 0.000826 |
| Decile 4 | 0.000816 |
| Decile 3 | 0.000806 |
| Decile 2 | 0.000795 |
| Decile 1 | 0.00078 |
| Minimum | 0.00068 |
|
|
- Mean = 0.000831436
- Std.dev = 4.59409e-05
- 30 items above graph maximum of 0.000994
|
Notes
Mean MD (mean diffusivity) in posterior thalamic radiation (right) on FA (fractional anisotropy) skeleton (from dMRI data)
0 Related Data-Fields
There are no related data-fields
2 Applications
| Application ID | Title |
|---|
| 17689 | Genetic, environmental and lifestyle predictors of brain/cognitive-related outcomes. |
| 22783 | The joint analysis of imaging data and genetic data for early tumor detection, prevention, diagnosis and treatment |

