Data
83,911 items of data are available, covering 79,384 participants.
Defined-instances run from 2 to 3, labelled using Instancing
2.
Units of measurement are AU.
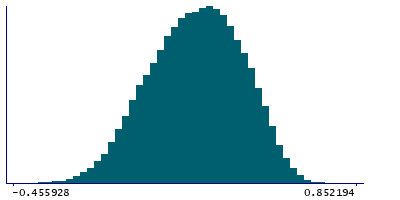
| Maximum | 0.852194 |
| Decile 9 | 0.465225 |
| Decile 8 | 0.39836 |
| Decile 7 | 0.345004 |
| Decile 6 | 0.296131 |
| Median | 0.248294 |
| Decile 4 | 0.198972 |
| Decile 3 | 0.146478 |
| Decile 2 | 0.0859525 |
| Decile 1 | 0.0074355 |
| Minimum | -0.482236 |
|
|
- Mean = 0.241049
- Std.dev = 0.174357
- 2 items below graph minimum of -0.450354
|
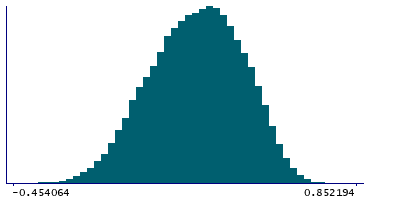
2 Instances
Instance 2 : Imaging visit (2014+)
79,153 participants, 79,153 items
| Maximum | 0.852194 |
| Decile 9 | 0.466426 |
| Decile 8 | 0.400018 |
| Decile 7 | 0.346562 |
| Decile 6 | 0.297959 |
| Median | 0.25027 |
| Decile 4 | 0.200964 |
| Decile 3 | 0.148267 |
| Decile 2 | 0.0879805 |
| Decile 1 | 0.008636 |
| Minimum | -0.482236 |
|
|
- Mean = 0.24269
- Std.dev = 0.174317
- 1 item below graph minimum of -0.449155
|
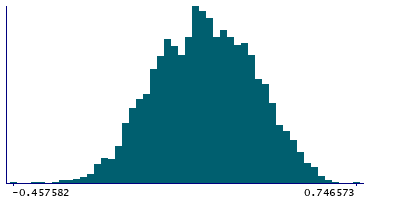
Instance 3 : First repeat imaging visit (2019+)
4,758 participants, 4,758 items
| Maximum | 0.746573 |
| Decile 9 | 0.439591 |
| Decile 8 | 0.368966 |
| Decile 7 | 0.314099 |
| Decile 6 | 0.263114 |
| Median | 0.21344 |
| Decile 4 | 0.171008 |
| Decile 3 | 0.115118 |
| Decile 2 | 0.059989 |
| Decile 1 | -0.0156105 |
| Minimum | -0.457582 |
|
|
- Mean = 0.213747
- Std.dev = 0.172738
|
Notes
Mean MO (diffusion tensor mode) in pontine crossing tract on FA (fractional anisotropy) skeleton (from dMRI data)
0 Related Data-Fields
There are no related data-fields
2 Applications
| Application ID | Title |
|---|
| 17689 | Genetic, environmental and lifestyle predictors of brain/cognitive-related outcomes. |
| 22783 | The joint analysis of imaging data and genetic data for early tumor detection, prevention, diagnosis and treatment |

