Data
83,911 items of data are available, covering 79,384 participants.
Defined-instances run from 2 to 3, labelled using Instancing
2.
Units of measurement are AU.
| Maximum | 0.846995 |
| Decile 9 | 0.644803 |
| Decile 8 | 0.59772 |
| Decile 7 | 0.558709 |
| Decile 6 | 0.522898 |
| Median | 0.486627 |
| Decile 4 | 0.447219 |
| Decile 3 | 0.402387 |
| Decile 2 | 0.346725 |
| Decile 1 | 0.266725 |
| Minimum | -0.293696 |
|
|
- Mean = 0.468844
- Std.dev = 0.147464
- 28 items below graph minimum of -0.111354
|
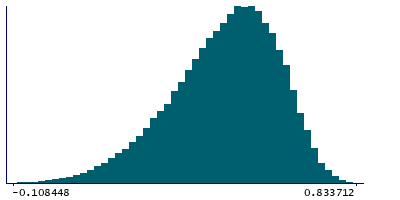
2 Instances
Instance 2 : Imaging visit (2014+)
79,153 participants, 79,153 items
| Maximum | 0.846995 |
| Decile 9 | 0.644809 |
| Decile 8 | 0.597706 |
| Decile 7 | 0.558606 |
| Decile 6 | 0.522841 |
| Median | 0.486573 |
| Decile 4 | 0.447097 |
| Decile 3 | 0.402453 |
| Decile 2 | 0.346687 |
| Decile 1 | 0.266662 |
| Minimum | -0.293696 |
|

|
- Mean = 0.468827
- Std.dev = 0.147394
- 26 items below graph minimum of -0.111485
|
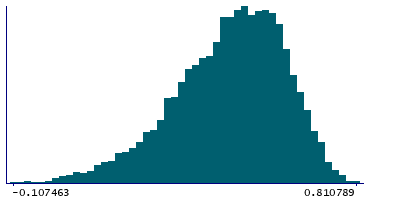
Instance 3 : First repeat imaging visit (2019+)
4,758 participants, 4,758 items
| Maximum | 0.810789 |
| Decile 9 | 0.644836 |
| Decile 8 | 0.597963 |
| Decile 7 | 0.560877 |
| Decile 6 | 0.523601 |
| Median | 0.487726 |
| Decile 4 | 0.449674 |
| Decile 3 | 0.401743 |
| Decile 2 | 0.347714 |
| Decile 1 | 0.268614 |
| Minimum | -0.125162 |
|
|
- Mean = 0.469134
- Std.dev = 0.148623
- 2 items below graph minimum of -0.107607
- 1 item above graph maximum of 0.810789
|
Notes
Mean MO (diffusion tensor mode) in corticospinal tract (right) on FA (fractional anisotropy) skeleton (from dMRI data)
0 Related Data-Fields
There are no related data-fields
2 Applications
| Application ID | Title |
|---|
| 17689 | Genetic, environmental and lifestyle predictors of brain/cognitive-related outcomes. |
| 22783 | The joint analysis of imaging data and genetic data for early tumor detection, prevention, diagnosis and treatment |

