Data
83,911 items of data are available, covering 79,384 participants.
Defined-instances run from 2 to 3, labelled using Instancing
2.
Units of measurement are AU.
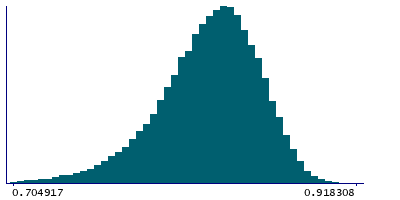
| Maximum | 0.918308 |
| Decile 9 | 0.862604 |
| Decile 8 | 0.851866 |
| Decile 7 | 0.84346 |
| Decile 6 | 0.836072 |
| Median | 0.828585 |
| Decile 4 | 0.820747 |
| Decile 3 | 0.811732 |
| Decile 2 | 0.800507 |
| Decile 1 | 0.782899 |
| Minimum | 0 |
|
|
- Mean = 0.824742
- Std.dev = 0.0346998
- 239 items below graph minimum of 0.703194
|
2 Instances
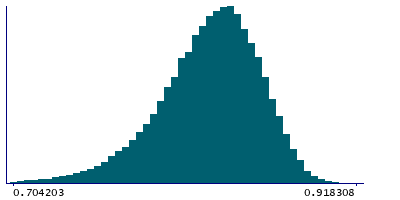
Instance 2 : Imaging visit (2014+)
79,153 participants, 79,153 items
| Maximum | 0.918308 |
| Decile 9 | 0.862615 |
| Decile 8 | 0.851866 |
| Decile 7 | 0.843427 |
| Decile 6 | 0.836048 |
| Median | 0.828499 |
| Decile 4 | 0.820653 |
| Decile 3 | 0.811571 |
| Decile 2 | 0.800276 |
| Decile 1 | 0.782573 |
| Minimum | 0 |
|
|
- Mean = 0.824645
- Std.dev = 0.0347156
- 220 items below graph minimum of 0.70253
|
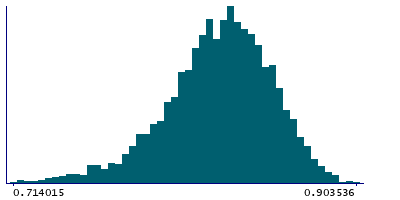
Instance 3 : First repeat imaging visit (2019+)
4,758 participants, 4,758 items
| Maximum | 0.903536 |
| Decile 9 | 0.8622 |
| Decile 8 | 0.851907 |
| Decile 7 | 0.843807 |
| Decile 6 | 0.836338 |
| Median | 0.829777 |
| Decile 4 | 0.822274 |
| Decile 3 | 0.814747 |
| Decile 2 | 0.804519 |
| Decile 1 | 0.78805 |
| Minimum | 0.109553 |
|
|
- Mean = 0.826356
- Std.dev = 0.0343969
- 18 items below graph minimum of 0.713901
|
Notes
Mean MO (diffusion tensor mode) in cerebral peduncle (left) on FA (fractional anisotropy) skeleton (from dMRI data)
0 Related Data-Fields
There are no related data-fields
2 Applications
| Application ID | Title |
|---|
| 17689 | Genetic, environmental and lifestyle predictors of brain/cognitive-related outcomes. |
| 22783 | The joint analysis of imaging data and genetic data for early tumor detection, prevention, diagnosis and treatment |

